

The first problem: how to introduce R visuals?
Designing for custom visuals involved several tasks. The first task was to make R visuals available to the custom visuals community. R visuals have their own set of technical requirements separate from other custom visuals because they require an R engine to run. Initially, the requirements from the engineering and PM team (based in Israel), were to create a gallery showcase for R custom-visuals.
Design process
I designed this based off of the existing custom visual gallery site, but incorporated helpful features for R users, such as the ability to view and copy the script for the visual. After further discussion and user-testing, we came to the conclusion that this would be best served as a component of the existing site, rather than a separate one. I altered the existing gallery to support pivots, with one highlighting R visuals and their varying requirements for use. Once we started work on the new custom visuals/Office store integration, we implemented a notification on the gallery site to warn users of the site's deprecation and impending transition.
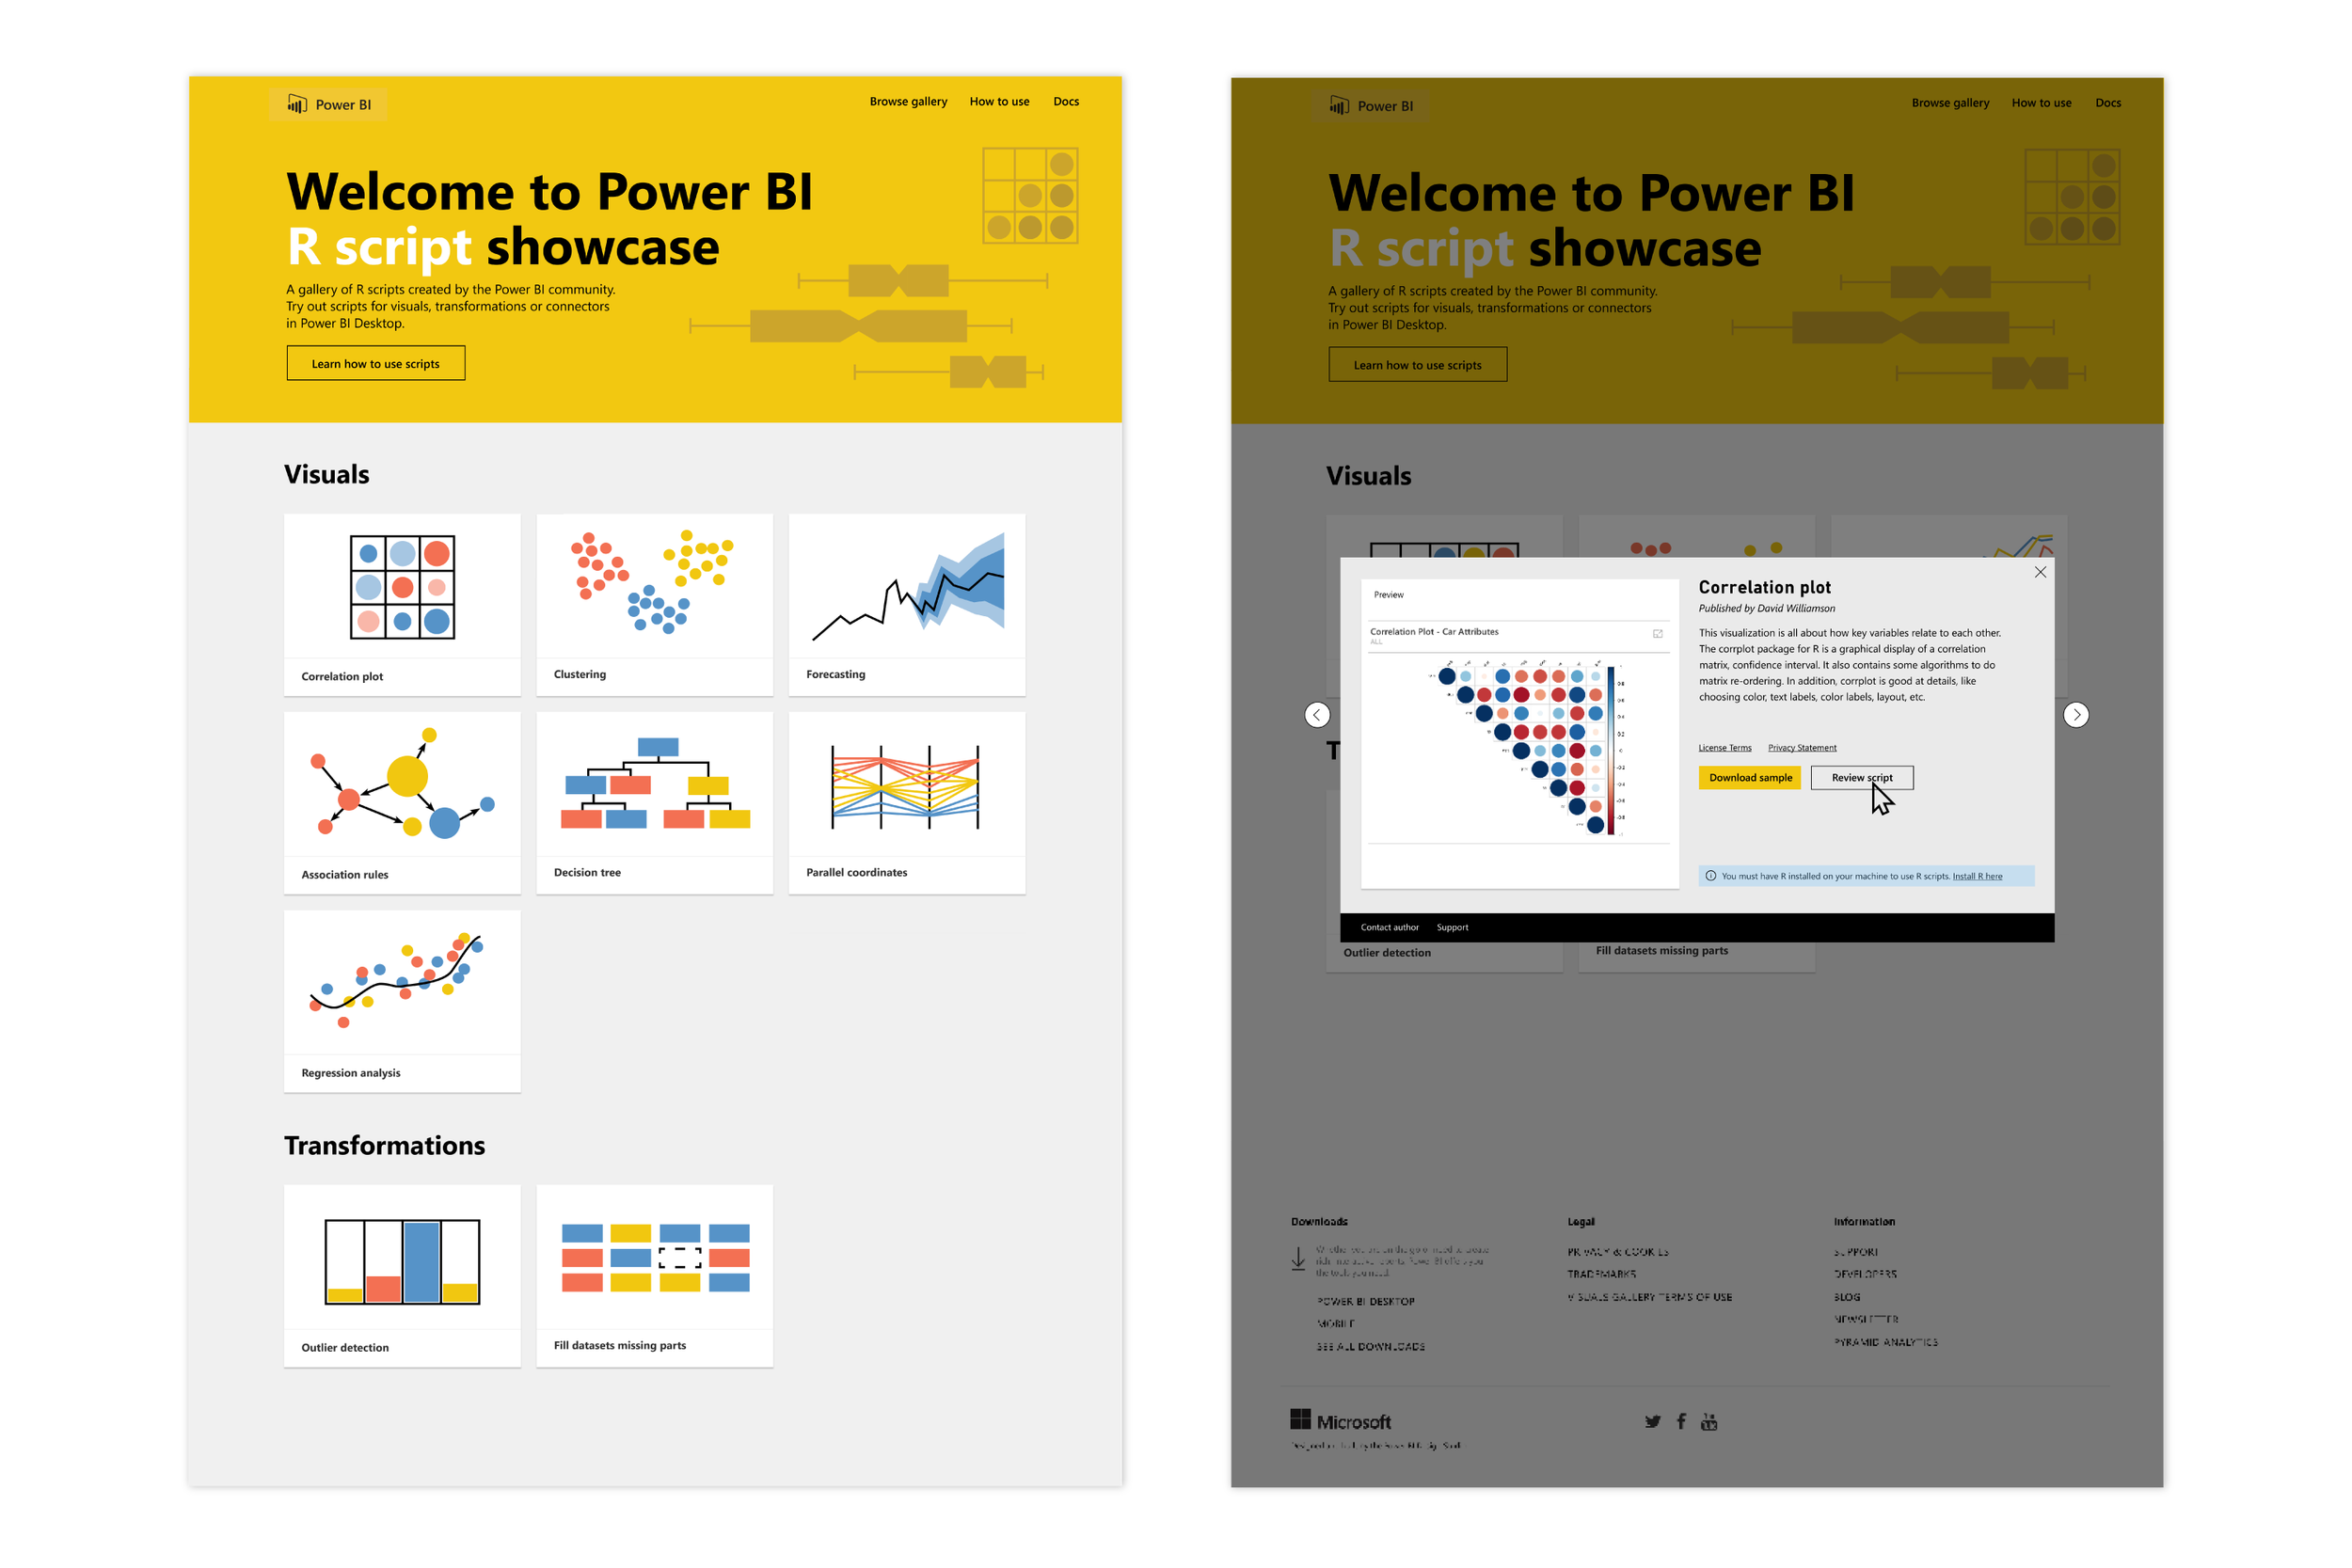
First cut: The above images represent the first incarnation of the R visuals showcase. The image showing details for the Correlation plot has some special considerations and requirements outlined just for R visuals. For example, the ability to “Review the script” - a highly sought-after feature from our more advanced analysts.
Updated R visuals gallery
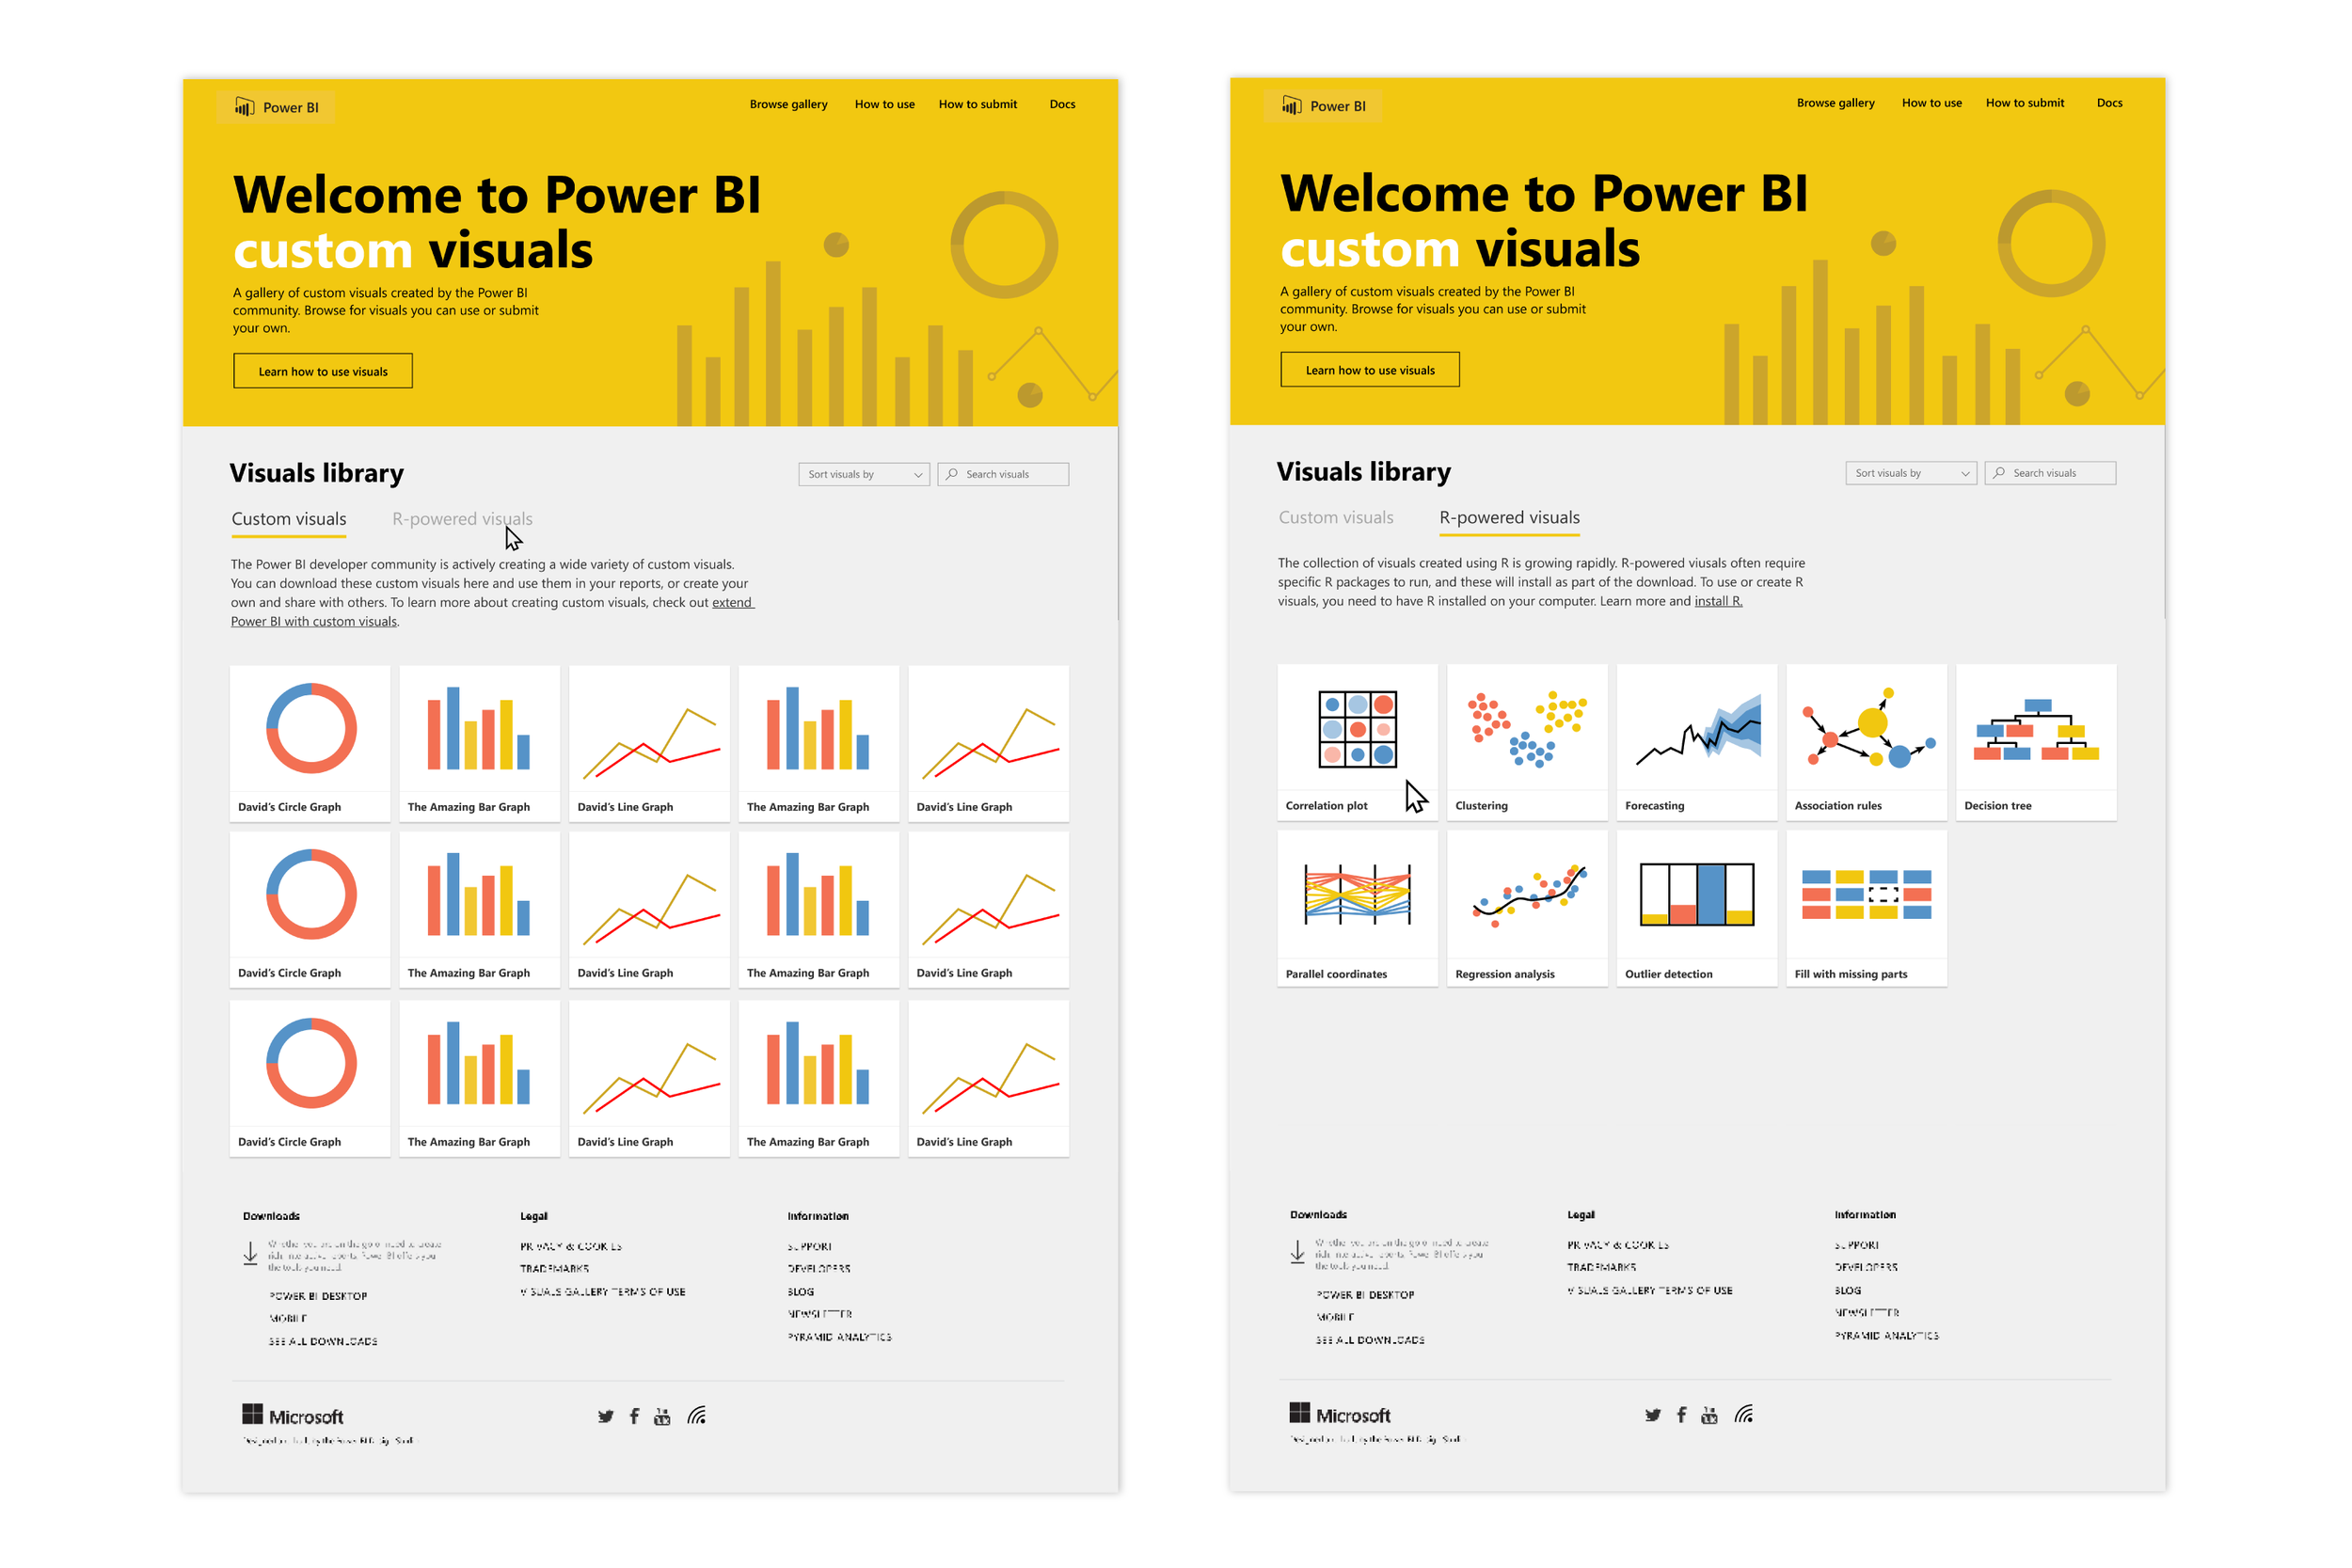
The updated gallery has the same capabilities as the one above, but was integrated into the existing custom visuals gallery rather than maintaining a unique URL.
This is beneficial to users because it allows more browsing and exploration of available visual types, but still separates them out for those looking for a more curated experience.
Next challenge: How to port custom visuals website into a native Office store experience?
After building out the gallery for R visuals, I started working on porting the entire gallery experience to an Office store experience for Power BI’s web and the desktop client. I led design from Redmond, Engineering and project management happened in Haifa, Israel, and we both worked with the Office store team, in Dublin, Ireland. It was both challenging and incredibly rewarding working across teams, continents and cultures to bring this project to fruition.
Design process
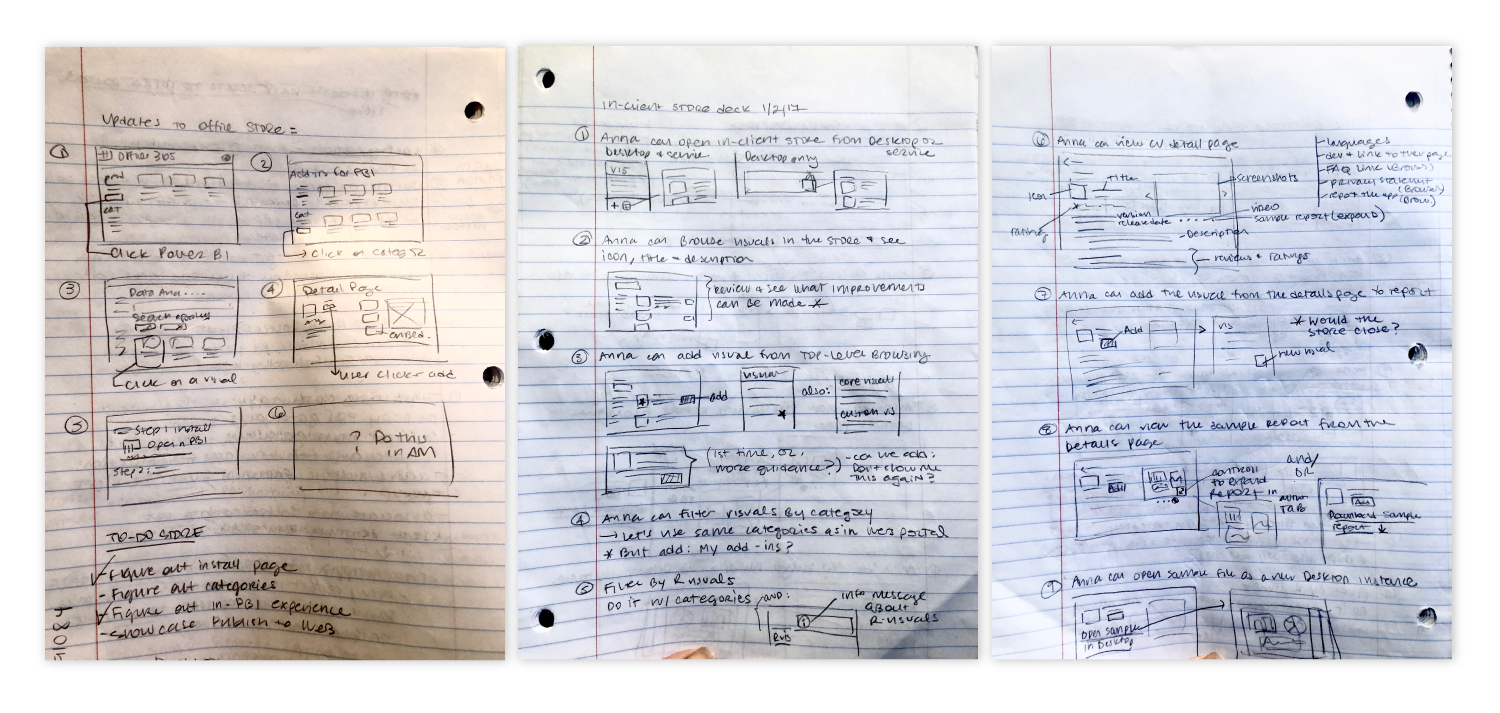
I started by researching several other Office stores in Microsoft products. For example, Outlook, PowerPoint, Excel and Word all have an in-client version of the Office Store. These stores offer add-ins, rather than custom visuals, but since our store would be built upon the same framework, it was important to understand the out of the box functionality. The first thing I always do in the design process is sketch out concepts and flows by hand. After several sketches, I start with wireframes and follow with higher fidelity mockups. Following the wireframes and mock-ups, we did several rounds of user-testing to validate our approach. In addition to working on the UI of the store itself, I also iterated heavily on entry points in the visualization pane and the ribbon.
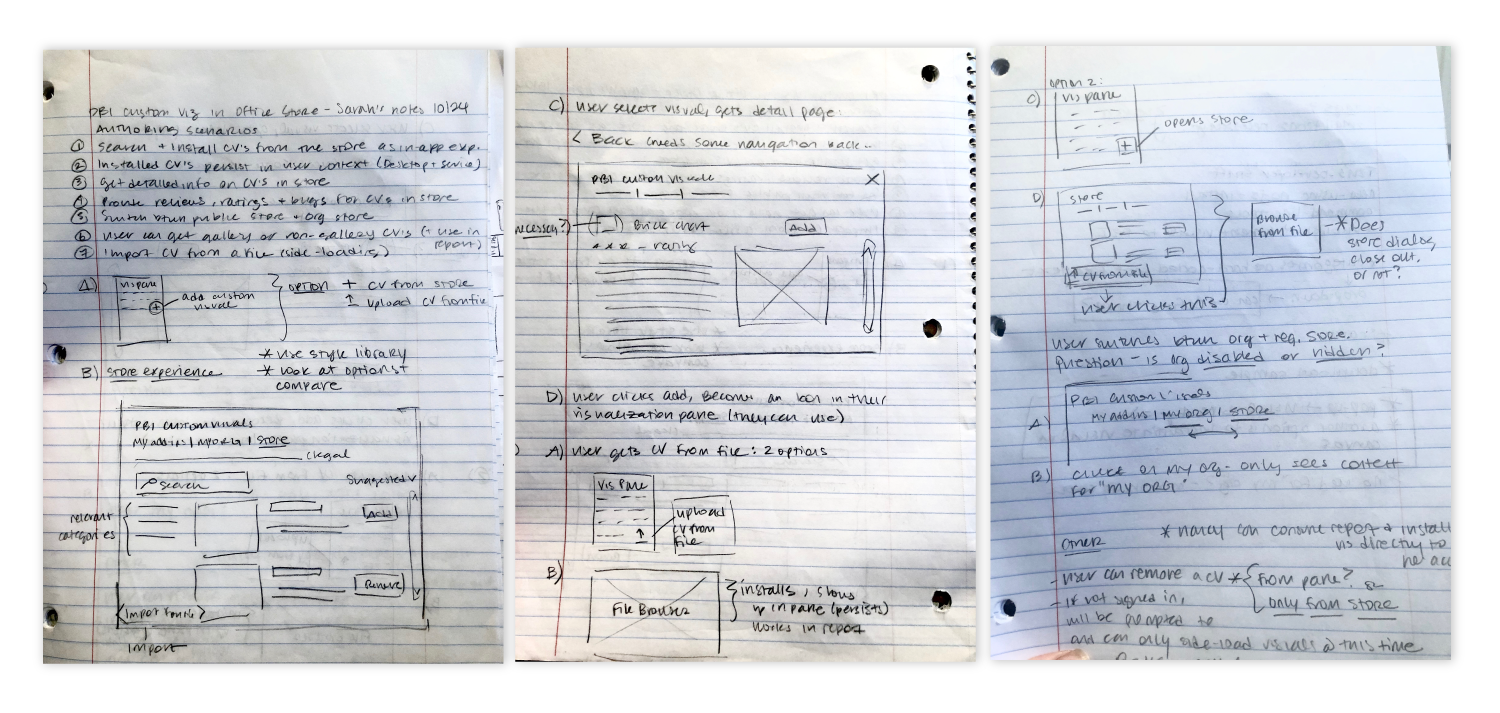
Initial sketches and requirements for custom visuals/Office store.
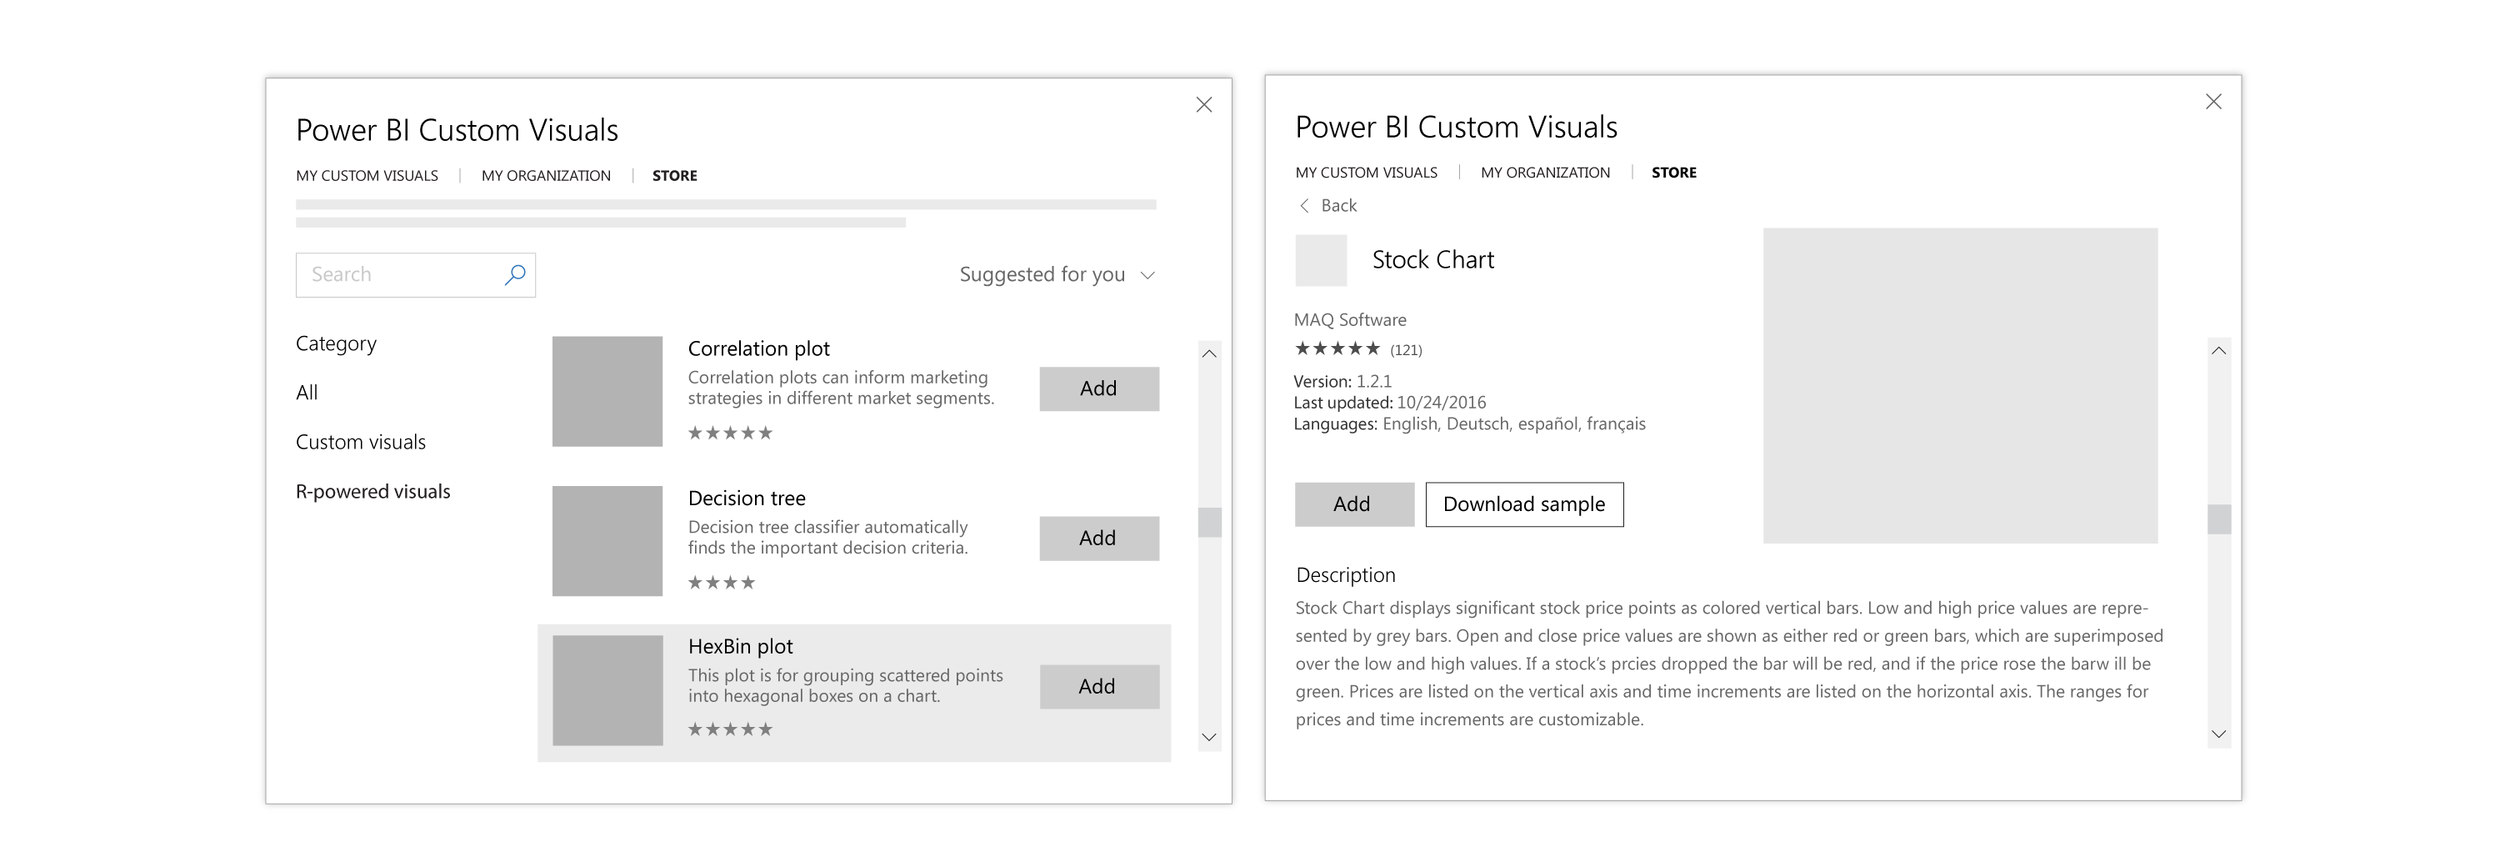
First round wireframes
The initial release of the Custom visuals store was fairly confined by the out-of-the-box Office store framework. We made certain adjustments however to optimize for the audience.
These include: larger thumbnails, ability to download samples, and promoting rating and author info.
These are high-fidelity versions for the first release of the Office store.
Entry point to store
Below are mock-ups of the visualizations pane in the Power BI report canvas. They show several different concepts for how to surface the Office store for custom visuals. The first entry point was buried in an ellipsis following the core visuals, but we found from user-testing that this was difficult to find and seldom used. One concept that tested well was breaking out core visuals and custom visuals for users, and allowing them to customize their workspace by collapsing or expanding certain sections.
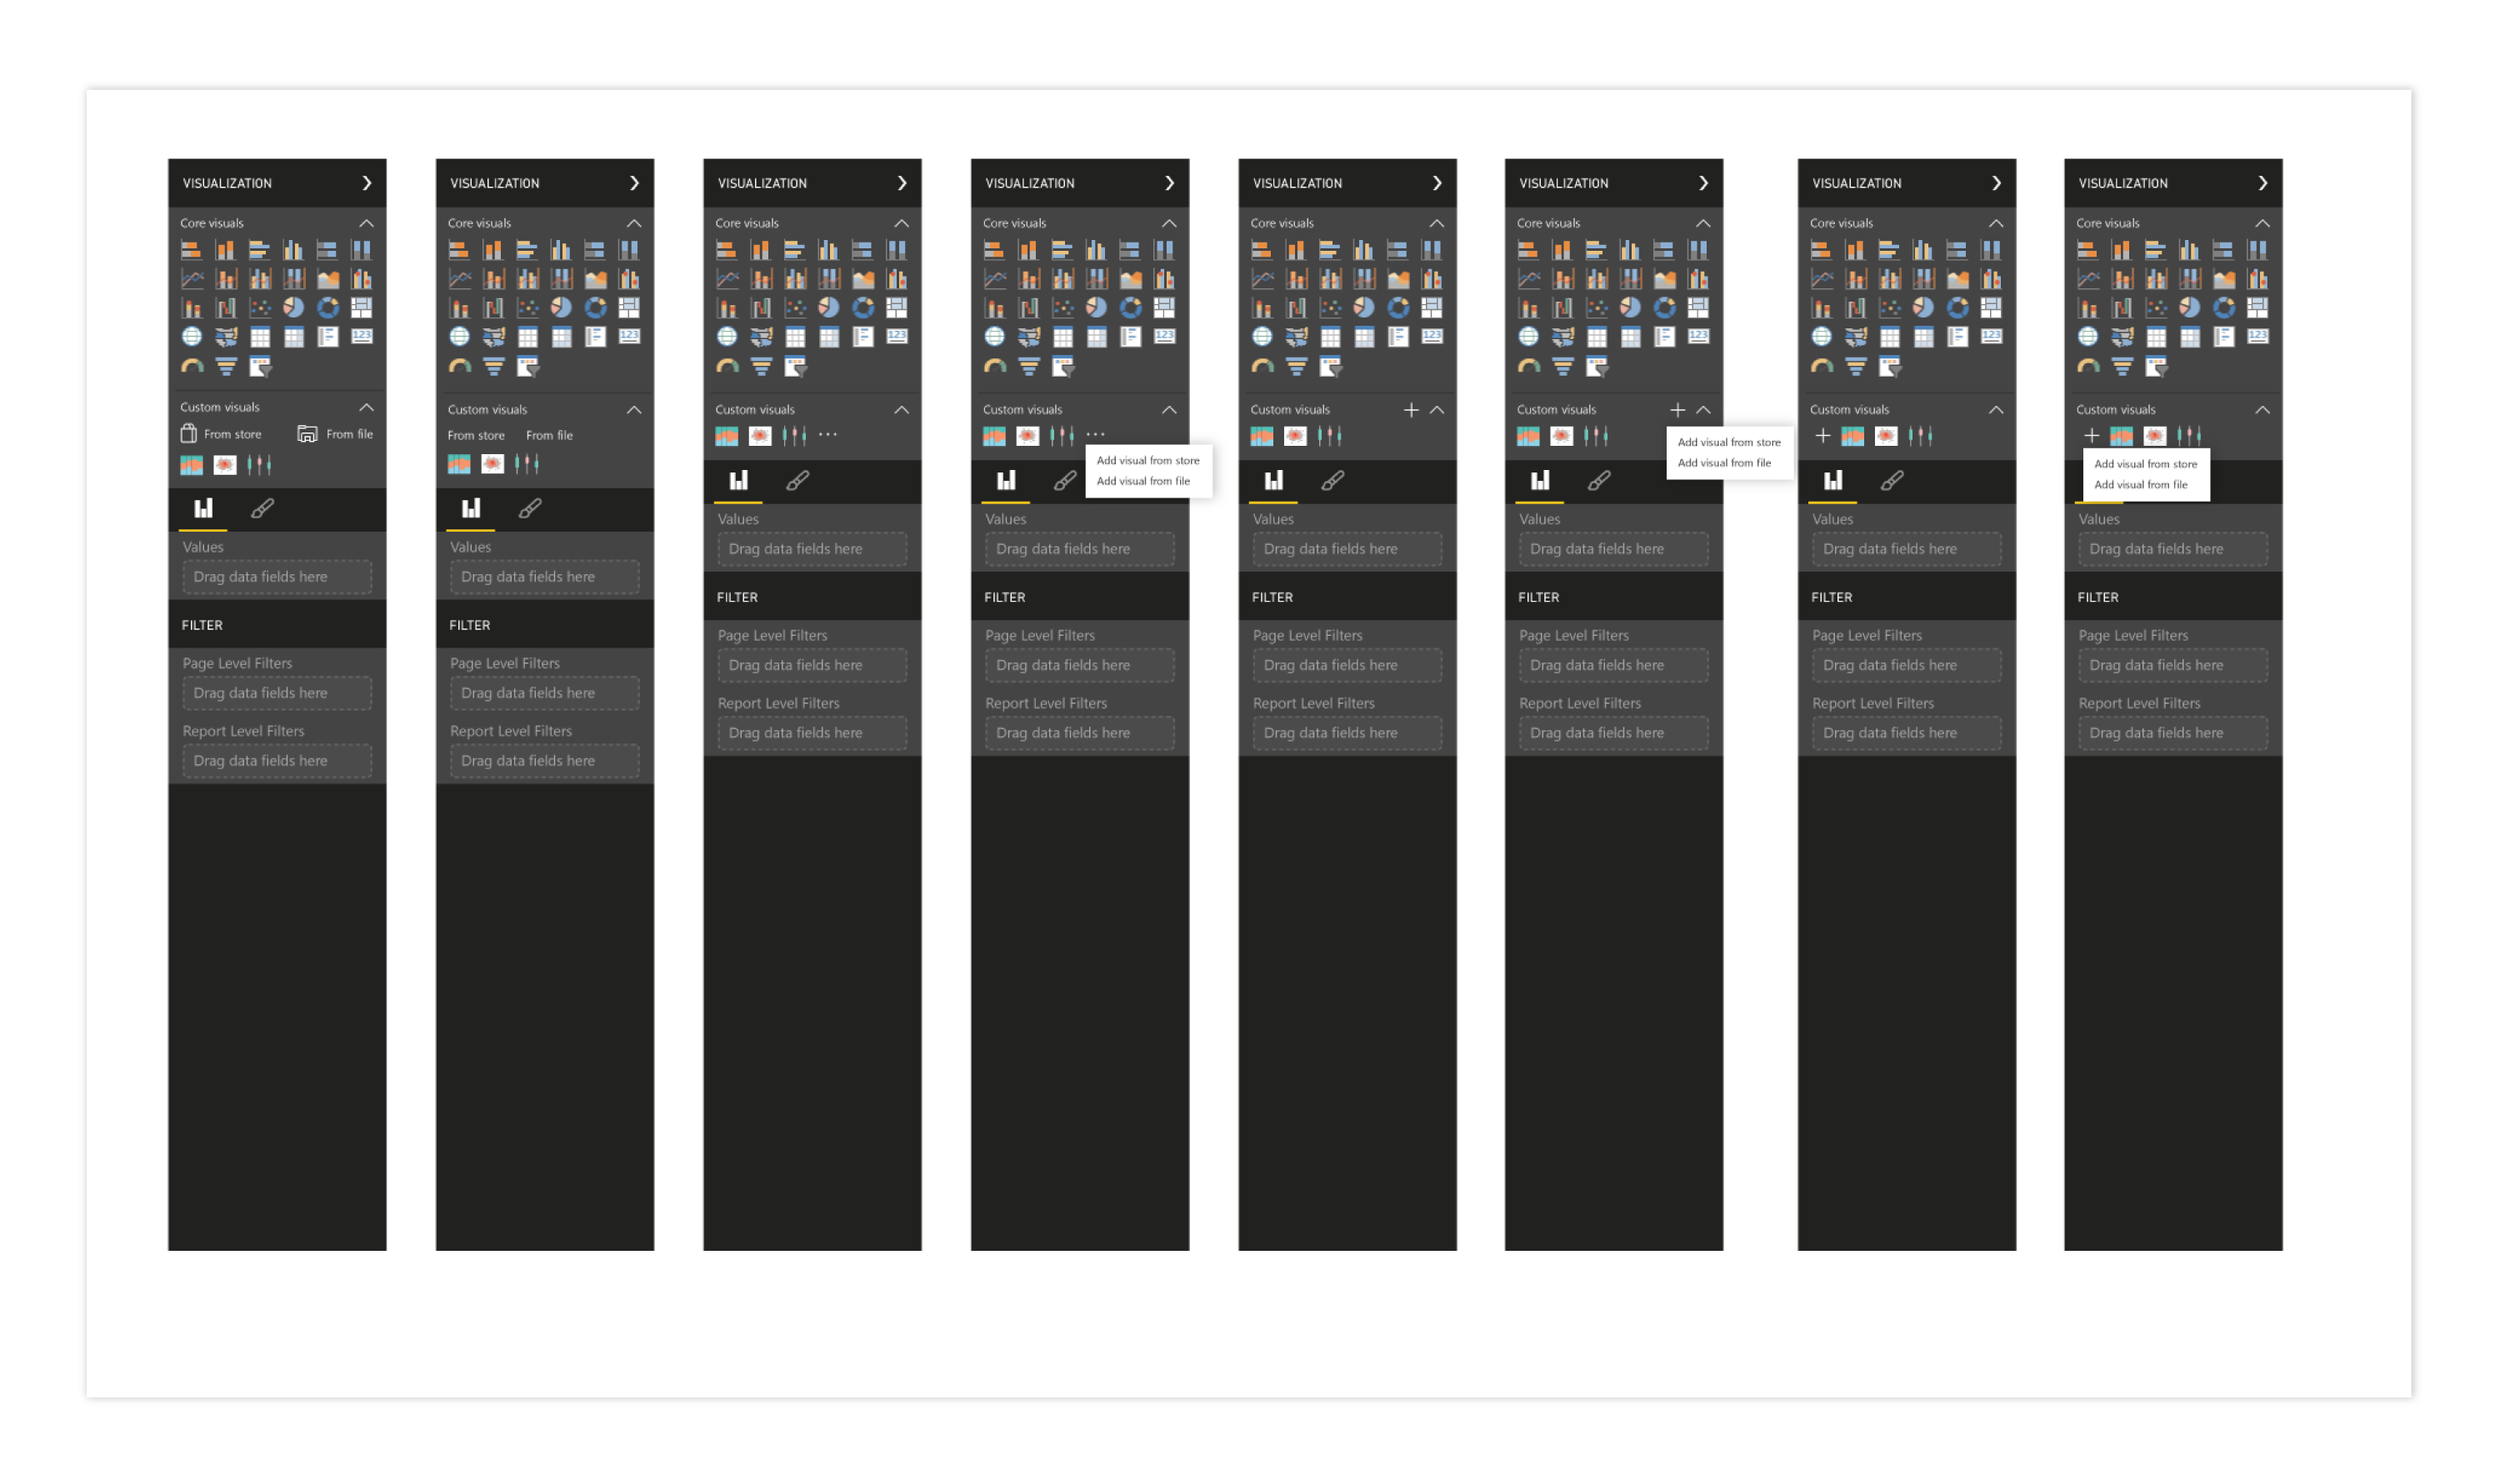
Alternative concept wireframes
At one point during the feature work, I learned that the developers would be spending a fair amount of time on the web portal, so I had ample time to go deeper with the UI for the in-client store. I brainstormed several new components, and built wireframes and mock-ups. I thought about different ideas such as featured visuals in a banner-like presentation, visual interactions with click and hover, and 'quick-add' functionality.
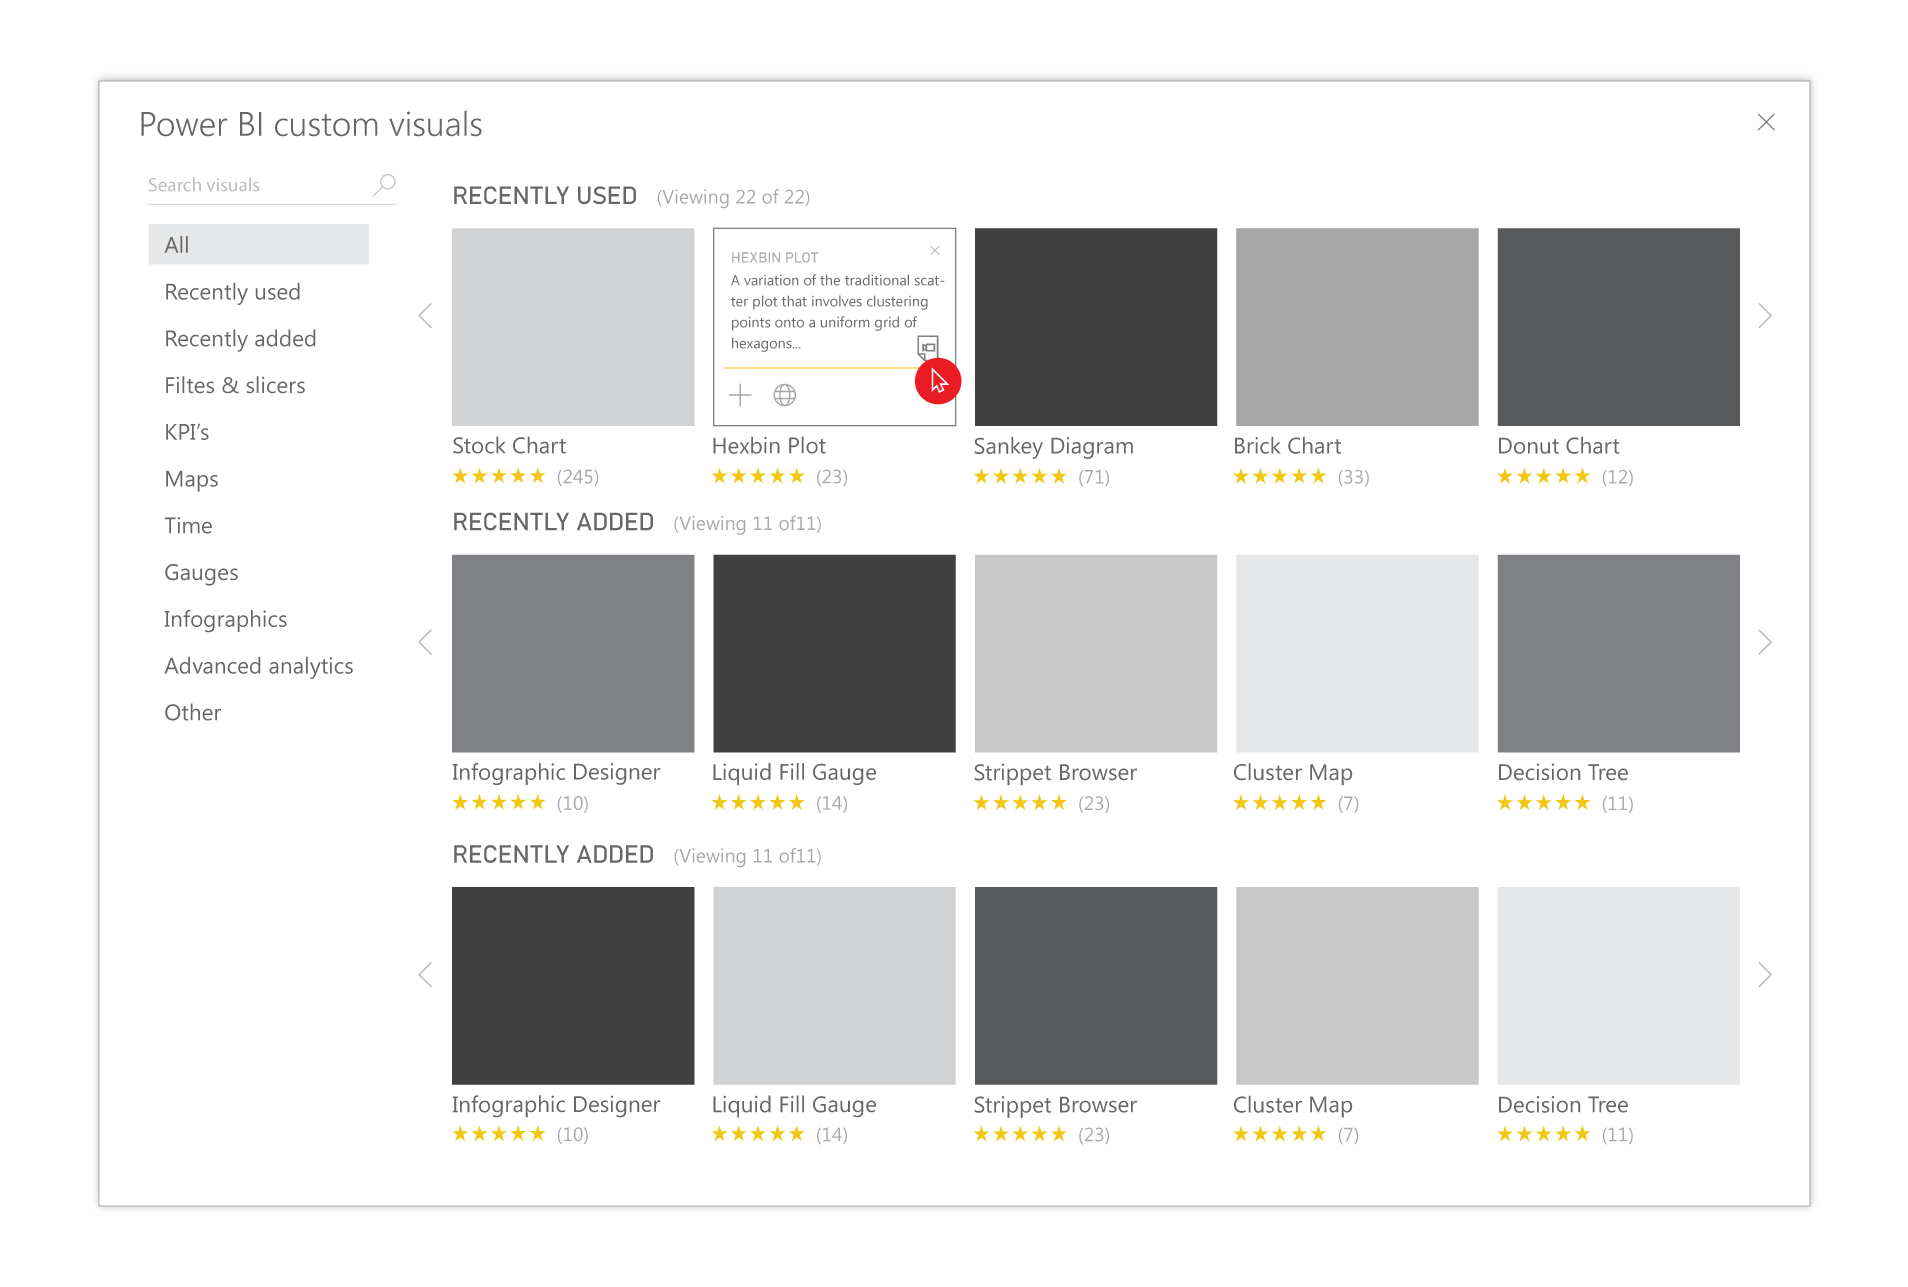
Alternate concept wireframes
Exploring different click and hover interactions and quick add interactions for users.
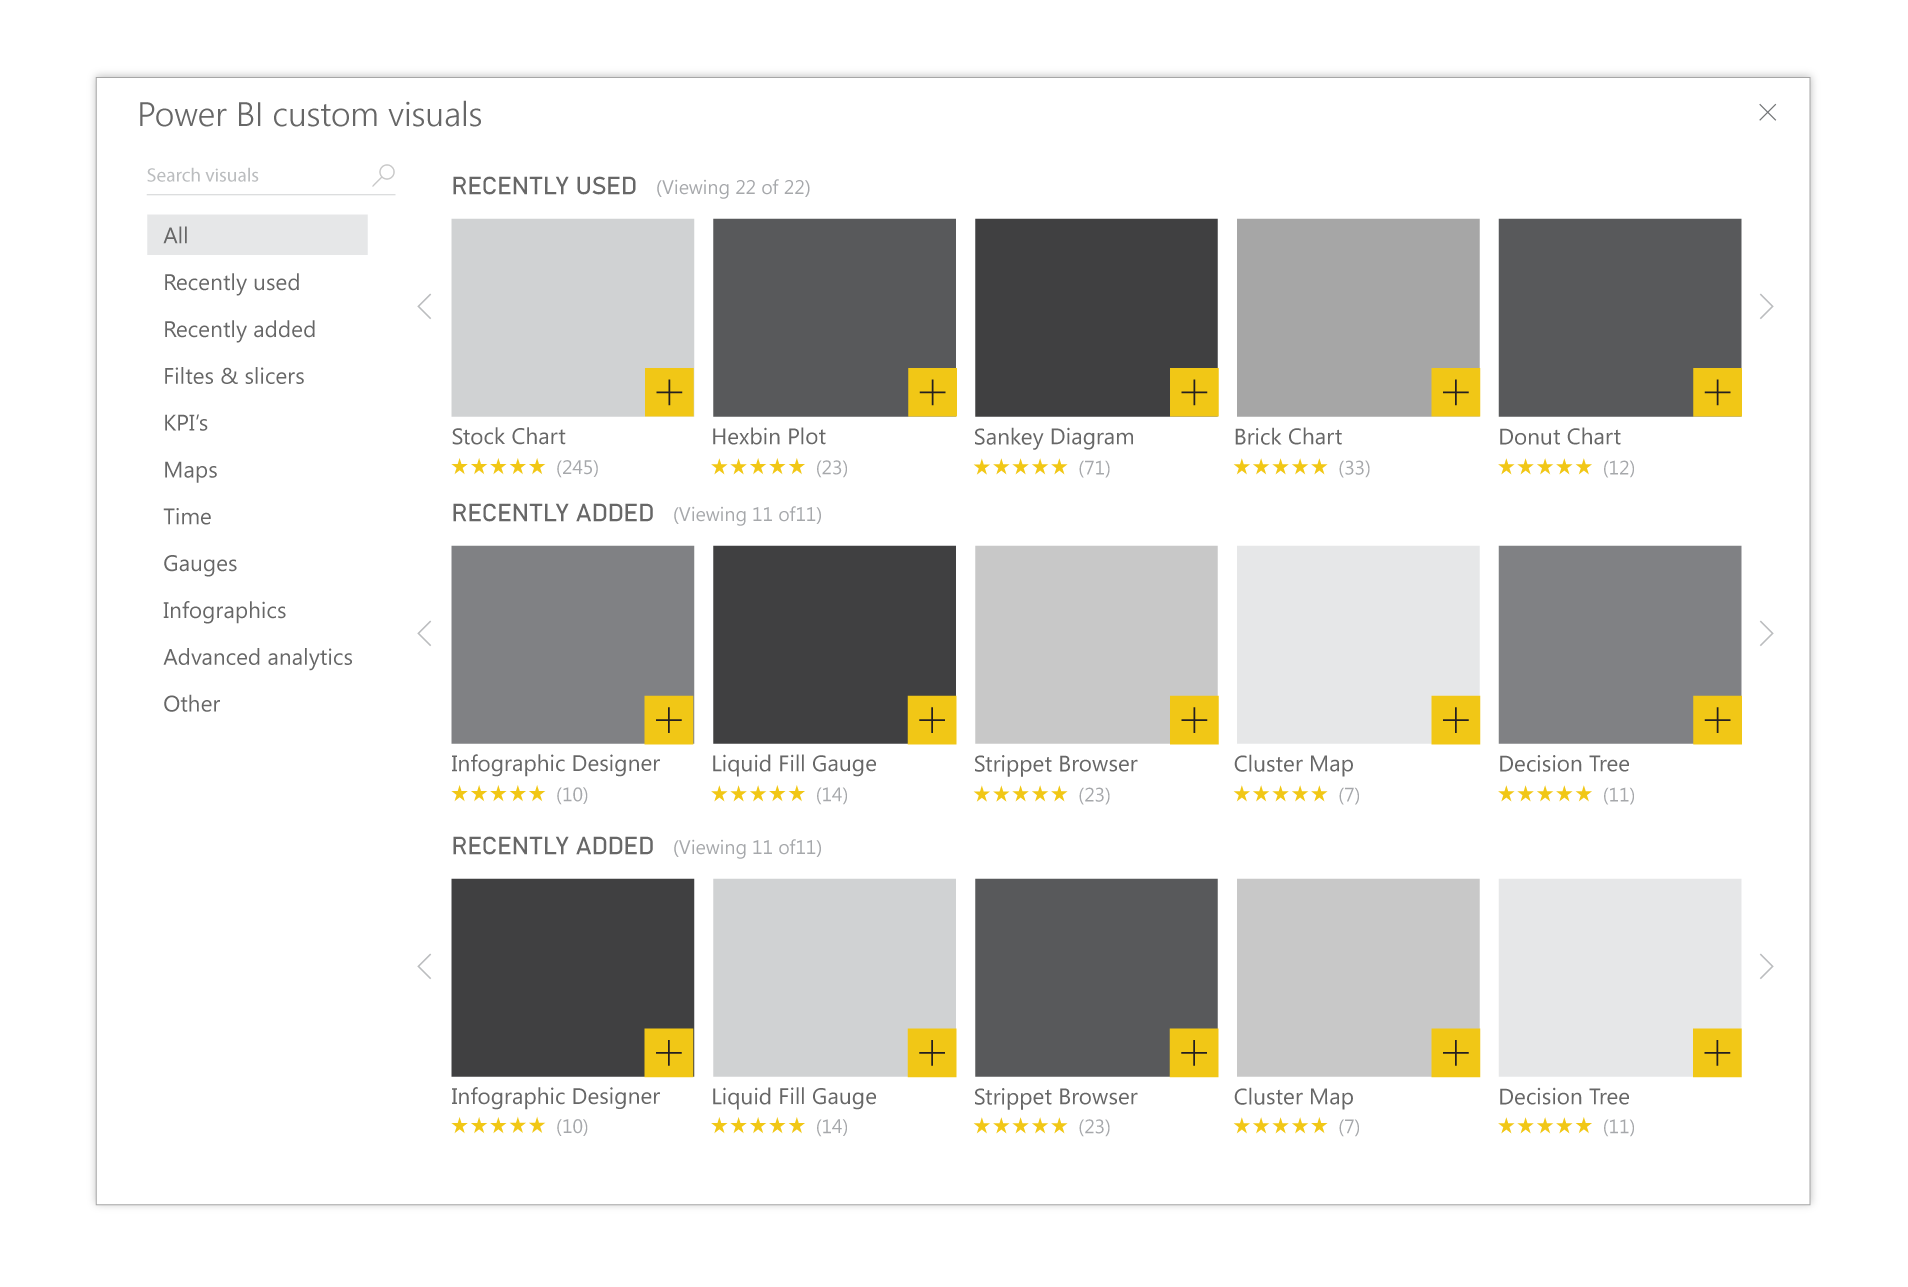
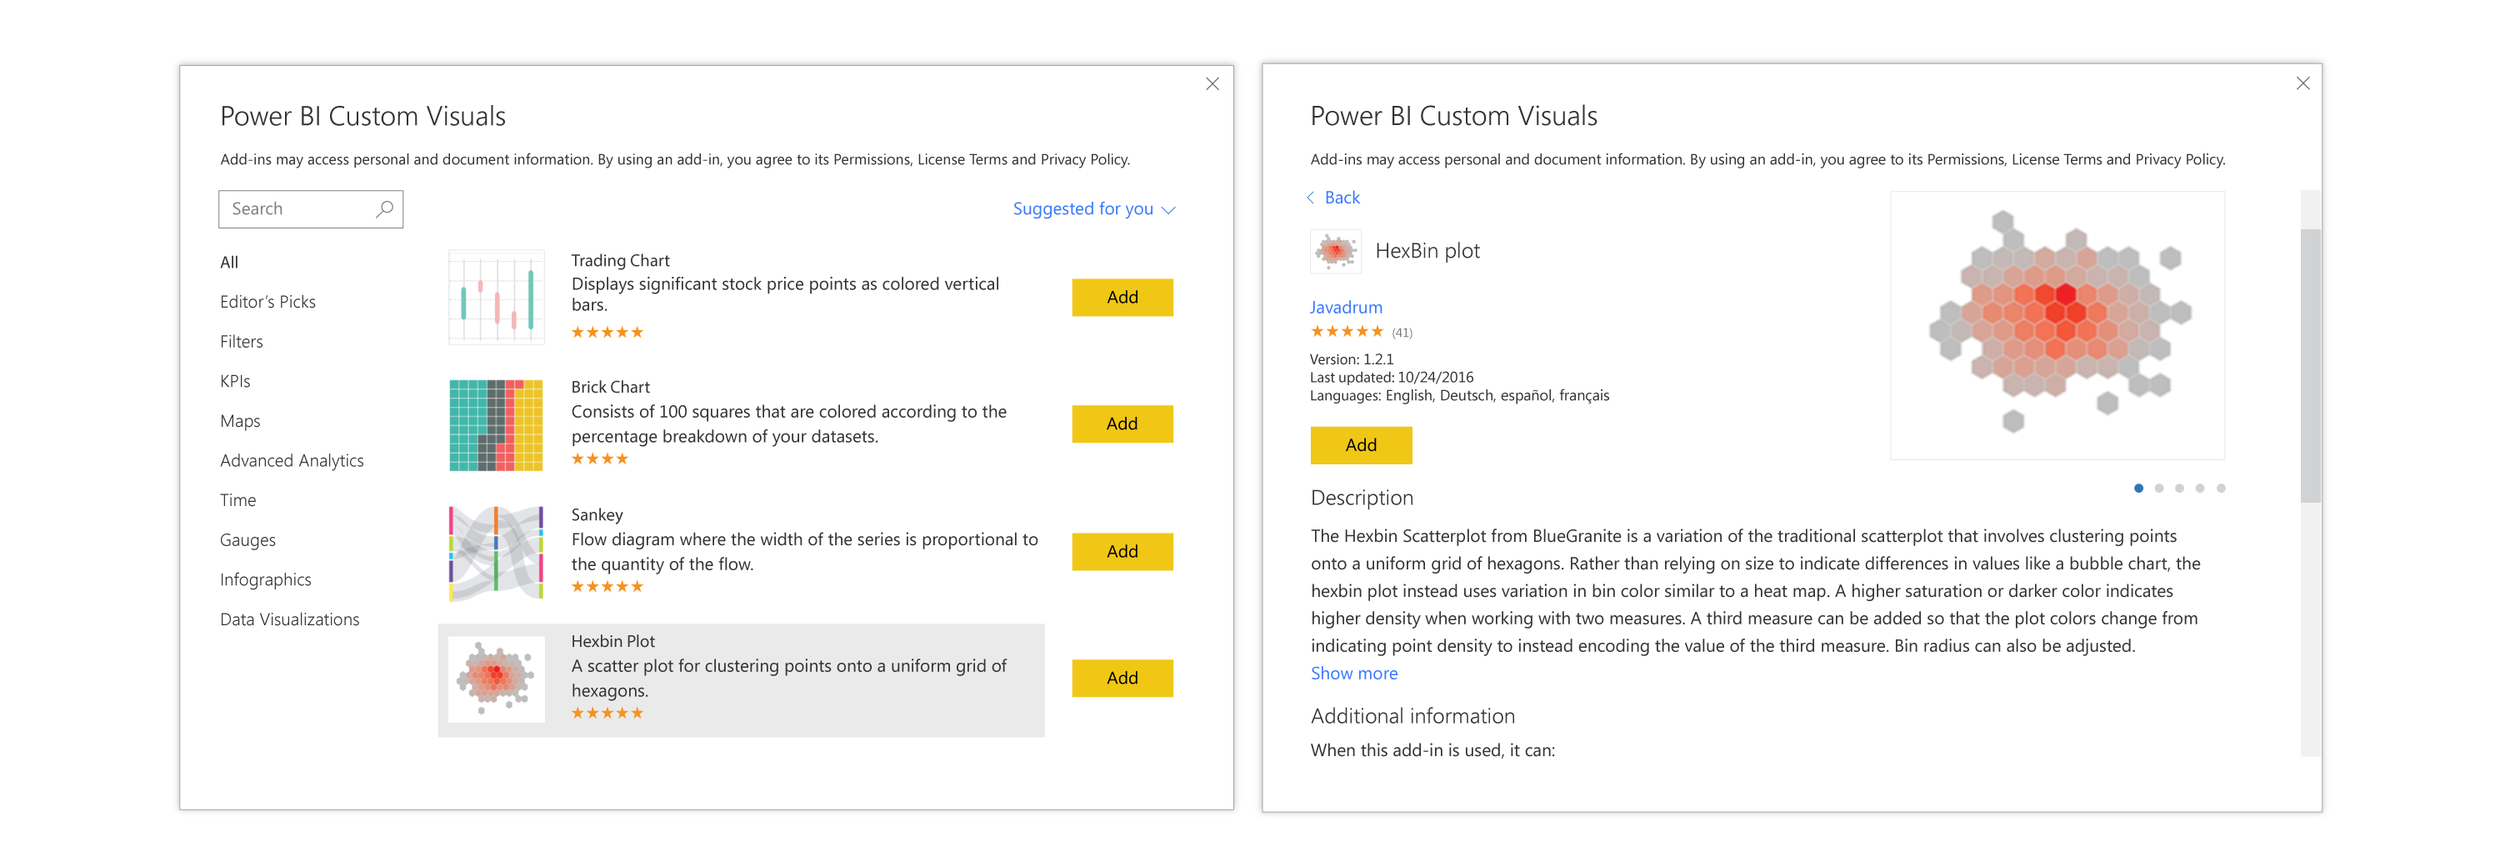
Alternative concept high-fidelity mocks
After going through the wireframe-exercise, I reviewed my work with the design team as well as users, and narrowed down my scope to the best-received features for high-fidelity mocks. Some of these include: similar, suggested custom visuals to try, options for sorting and filtering, list view v. grid view, larger thumbnails, larger preview, multi-select and link to open sample of visual in the browser.
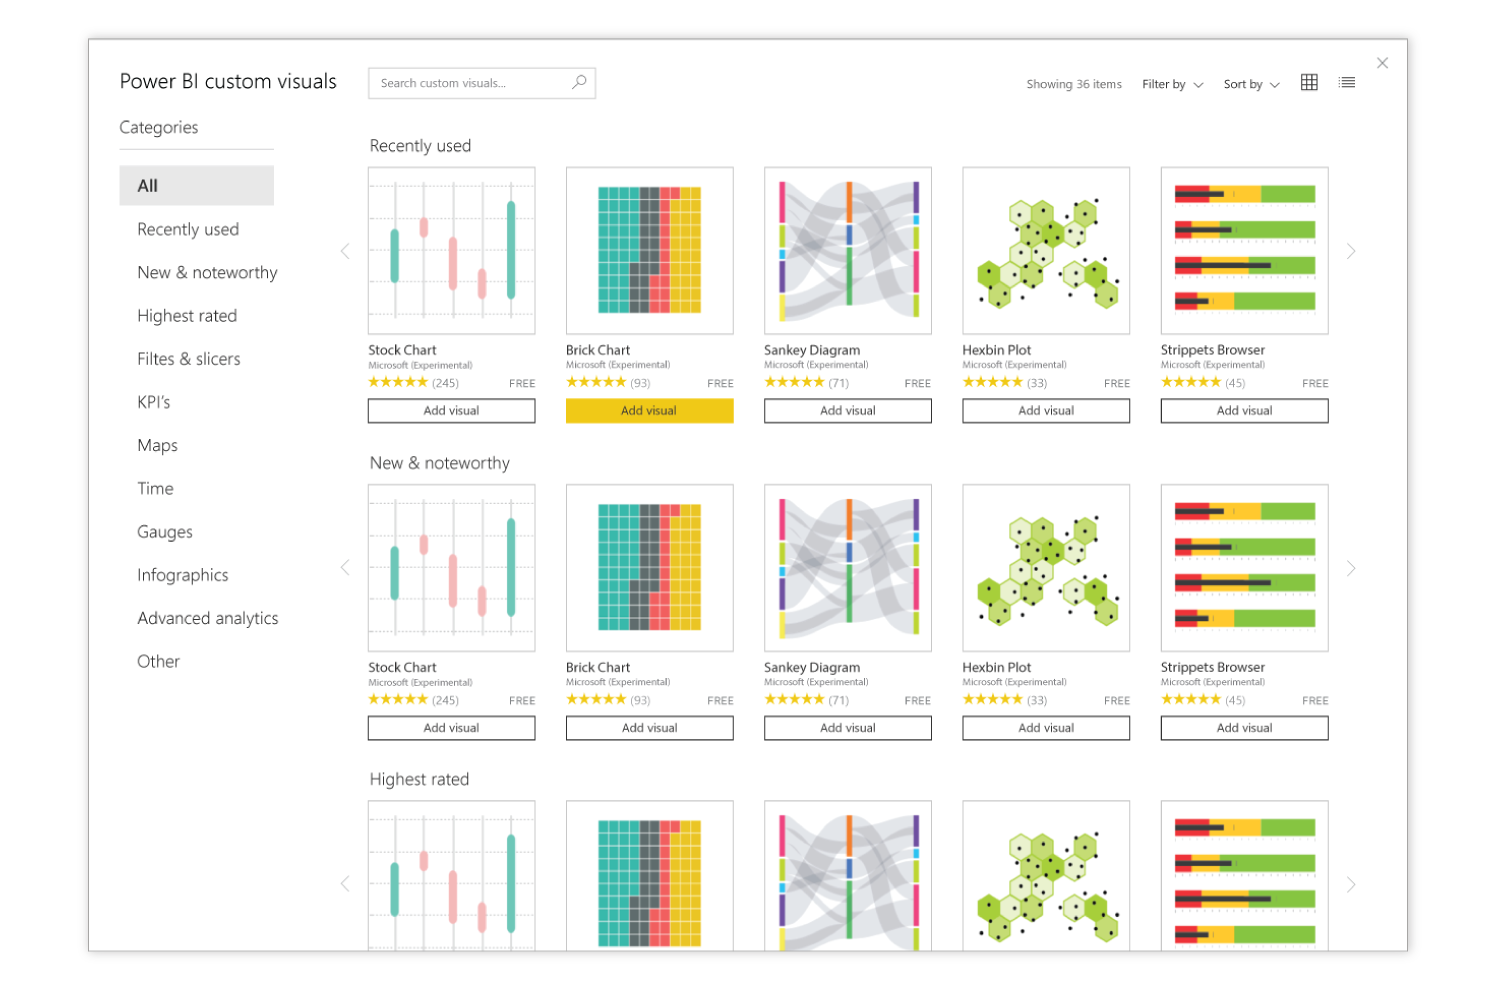
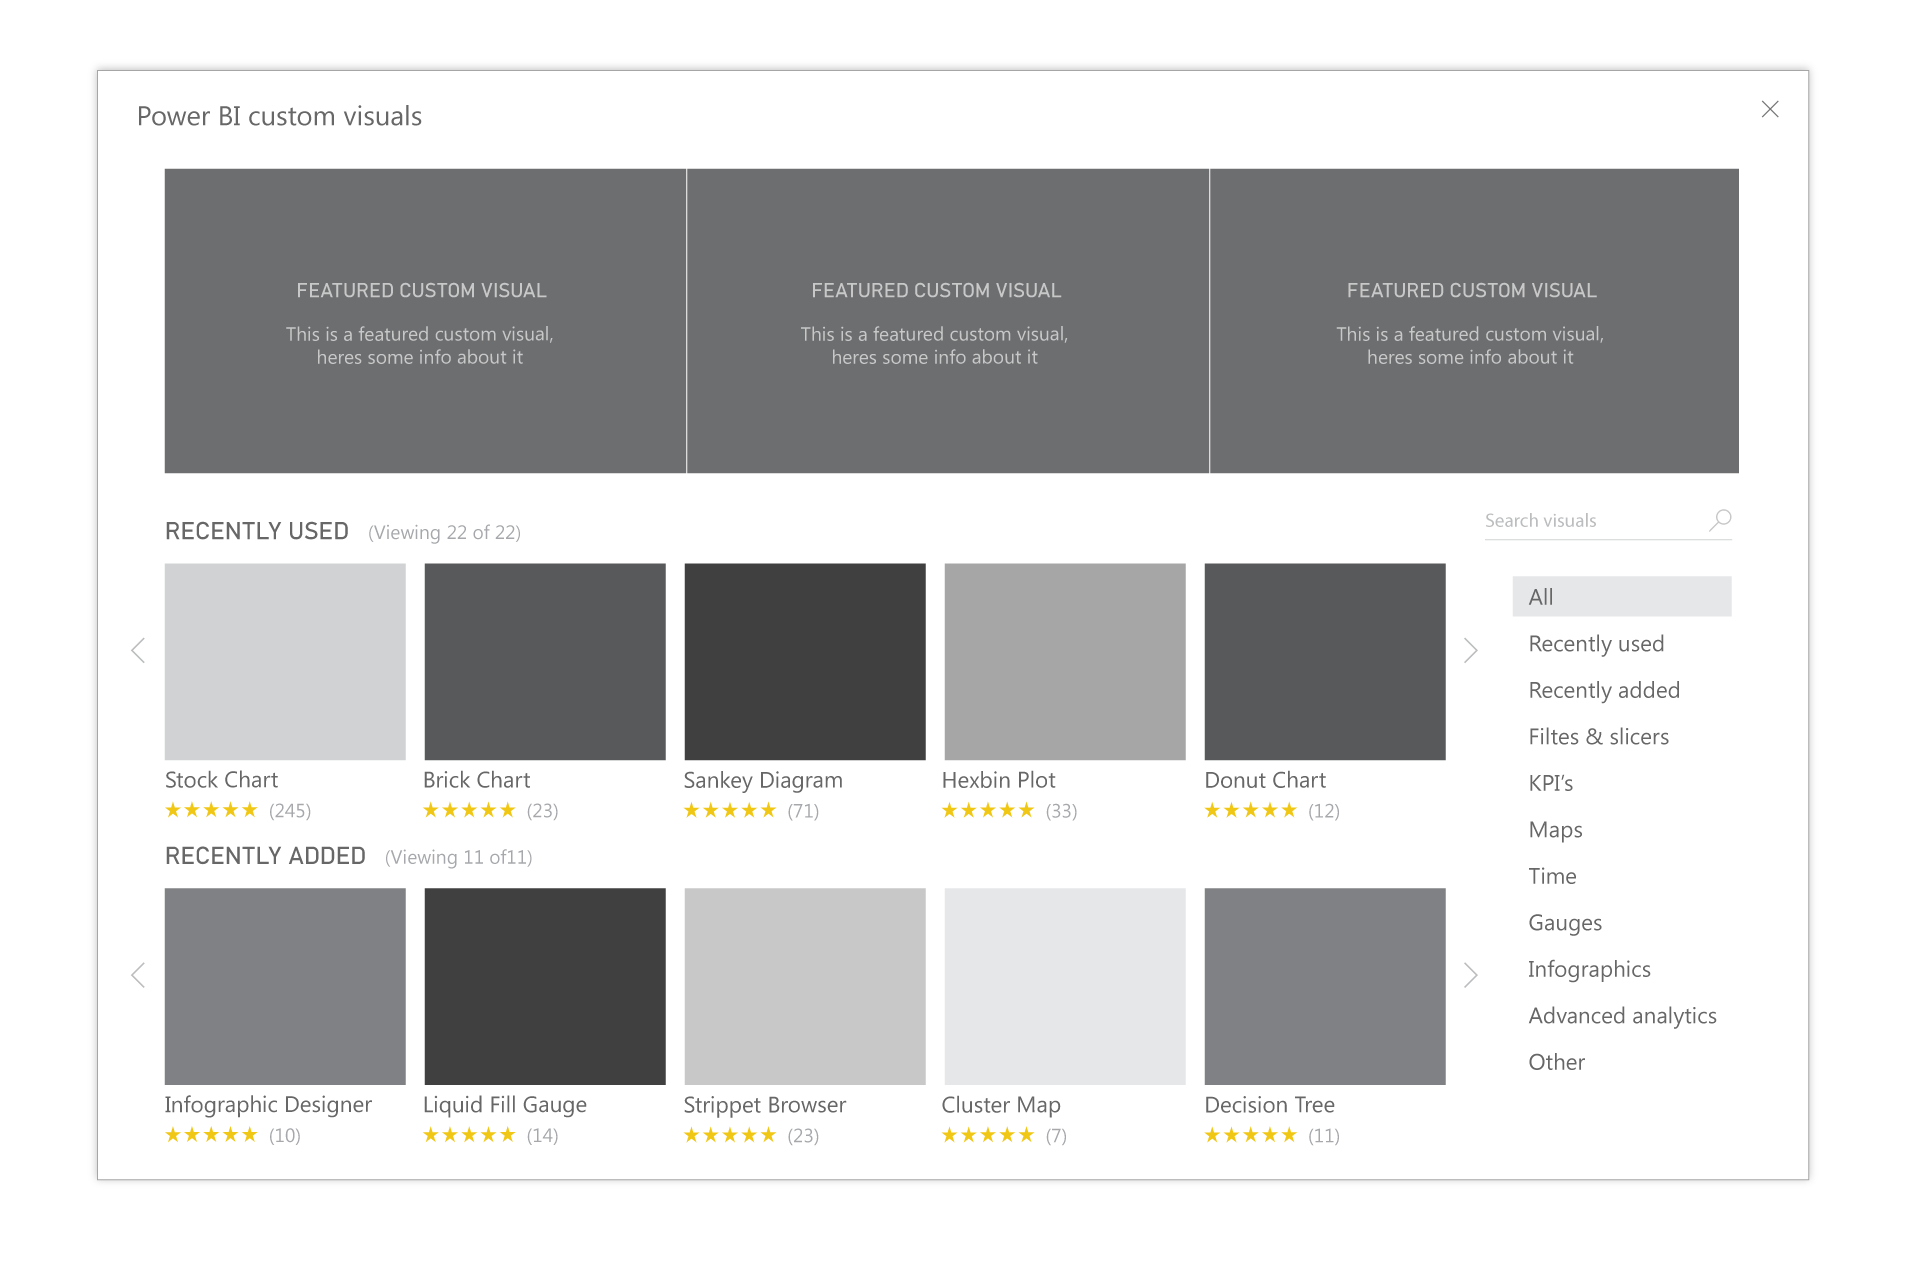
Updated custom visuals store
The left and below images show updated designs for the custom visuals marketplace. The store prioritizes thumbnails as the main way users are distinguishing one visual from the next. Name, rating and author are also high-level pieces of information.
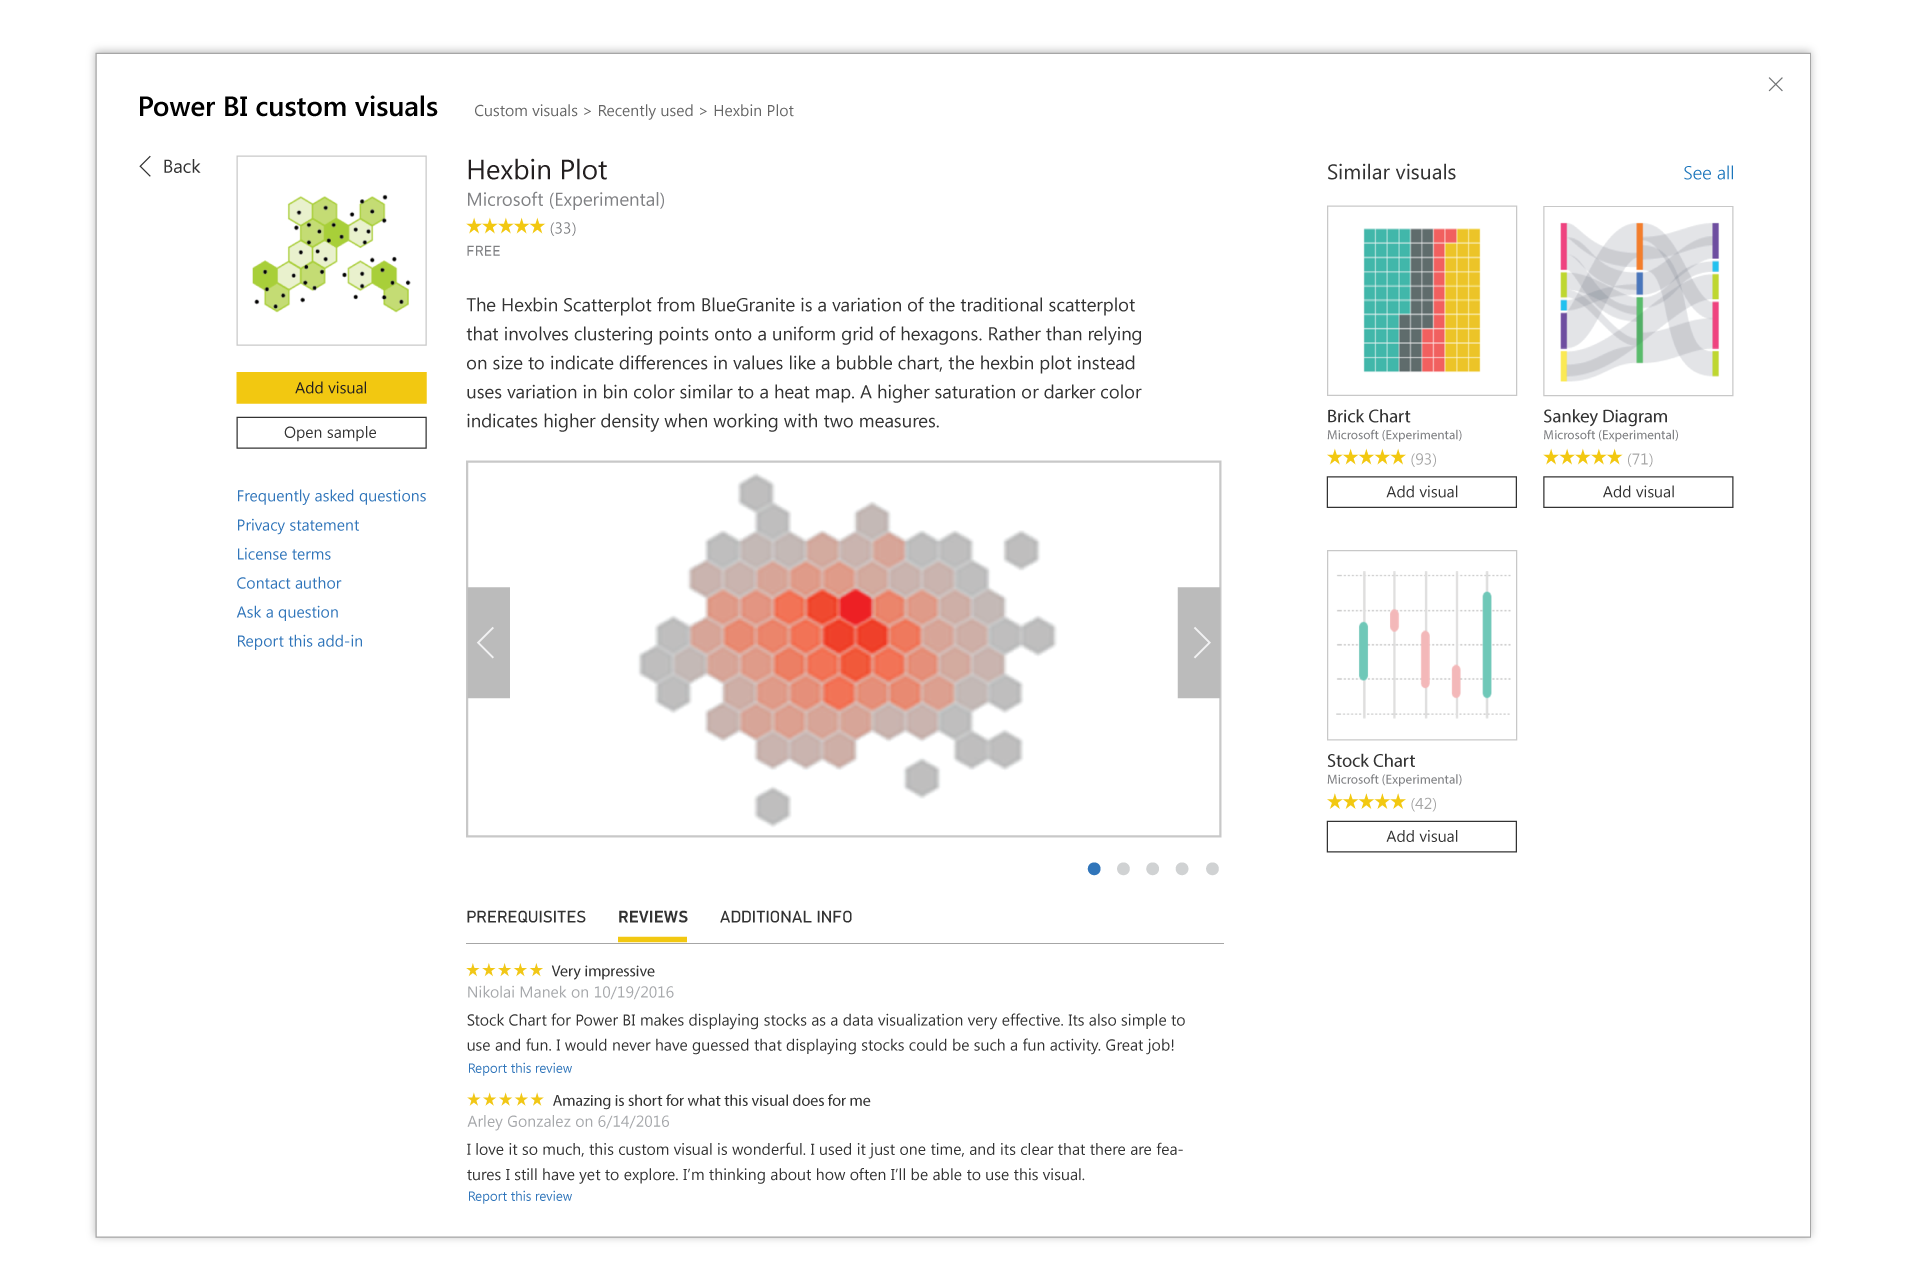
The concept of offering up ‘Similar visuals’ was very popular with the users we tested with. They liked the fact that it could lead to more browsing and new ideas for representing data in their reports. We also maintained the concept of opening a sample, as this was important for users to determine if the custom visual would meet their needs.
R visuals in Office store
I also accounted for R visuals in all of my explorations. R visuals are branded with the R logo and the term "Built with R" to help users understand that they have slightly different requirements than other custom visuals (see image below). There is also an informational message at the top with further links to learn more. R visuals also have their own category in the Office store; they can be found under the 'Advanced Analytics' tab. While all of my more in-depth explorations were well-received, priorities shifted and there was no longer the extra window for further development on this feature. We were still able to roll out the original concept based more closely on similar Office stores, and throughout the process gain a deeper understanding of user preferences and motivations when it comes to 'shopping' for custom visuals.
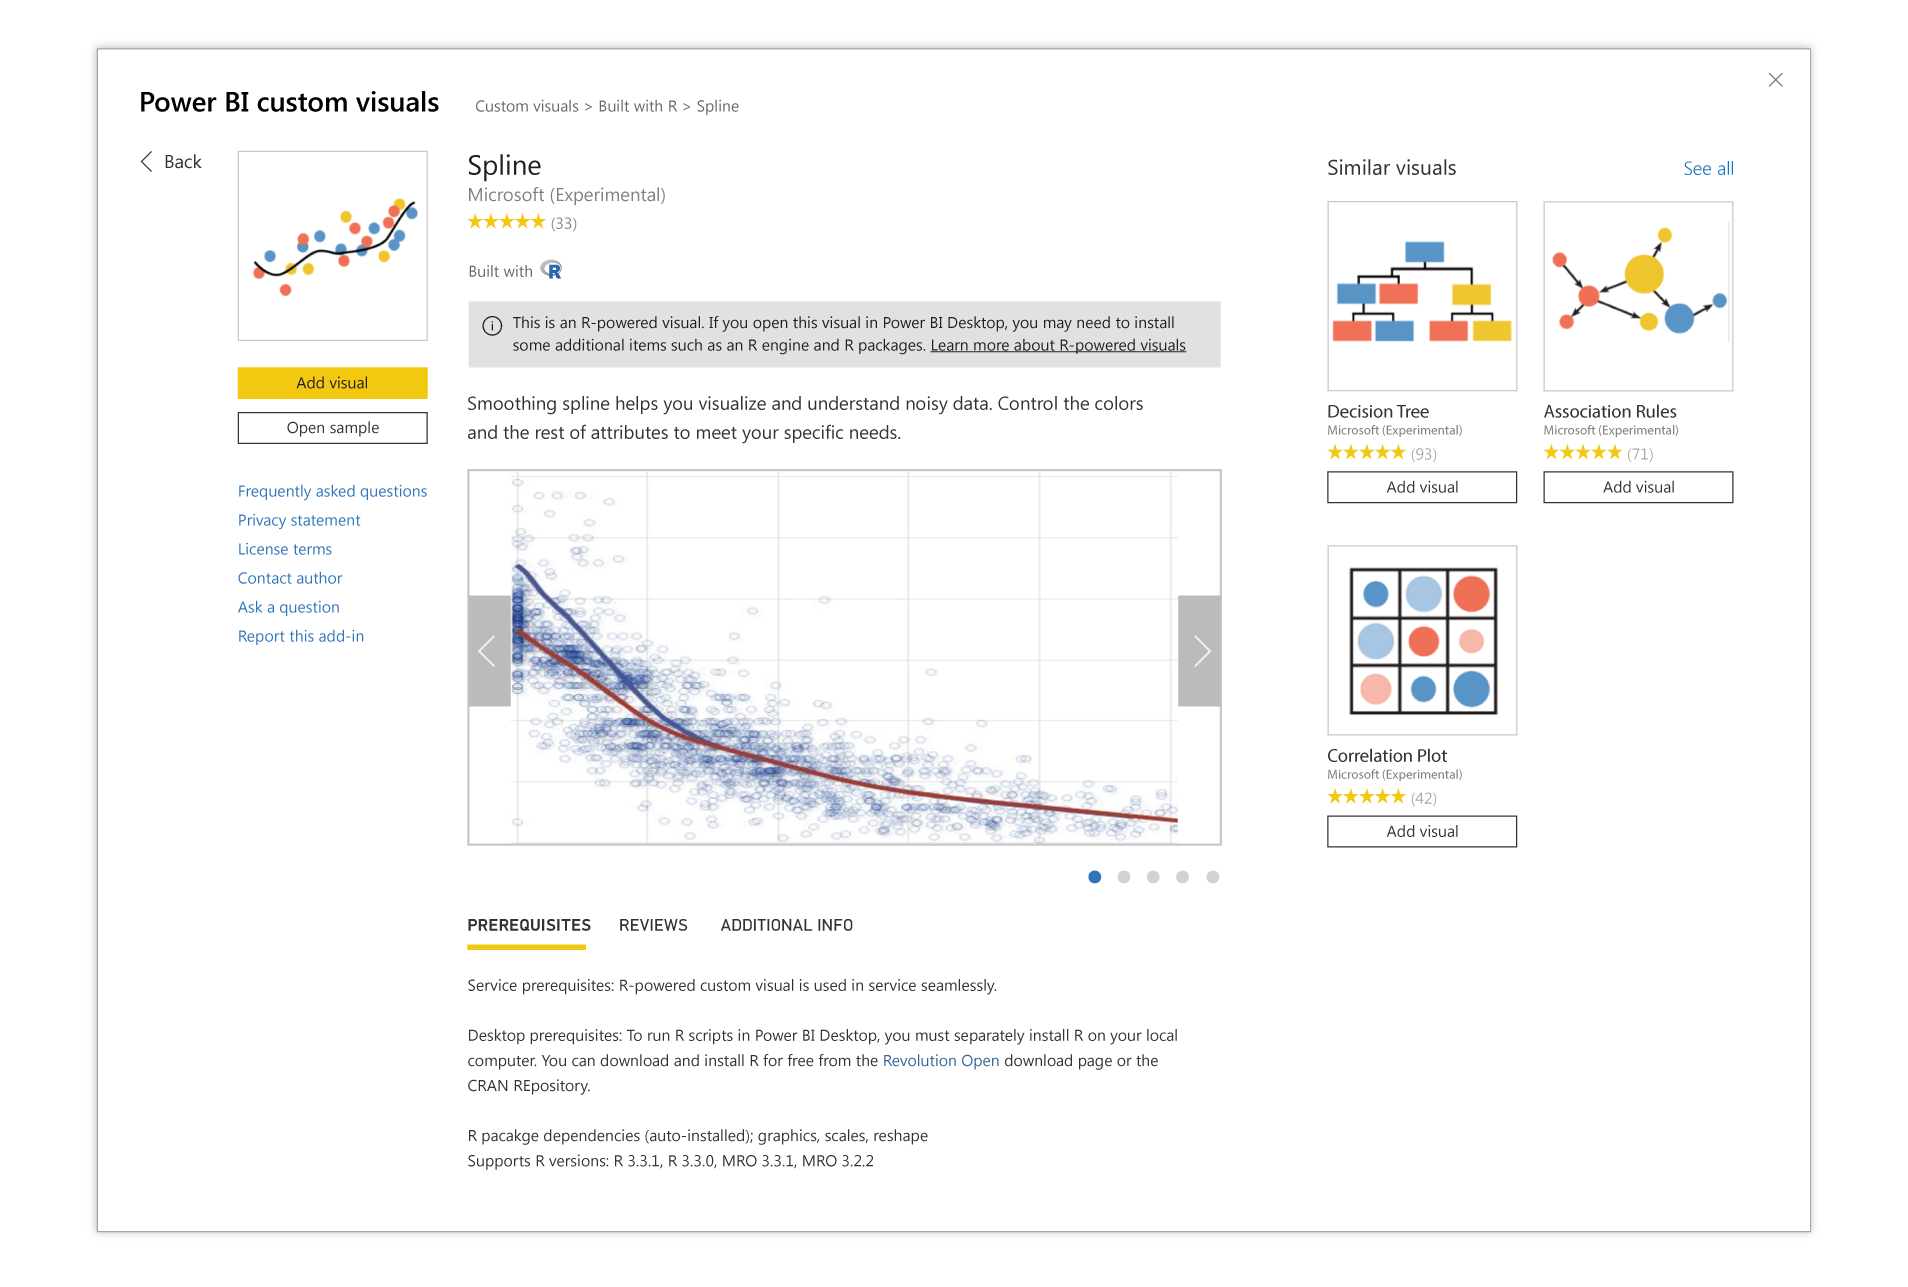
A detail page for an R visual in the custom visuals store. Unique attributes include the Built with R logo and informational banner highlighting the different requirements to run these visuals on a user’s machine
Power BI custom visuals in the news:
Custom Visuals now Available in Office Store
Custom Visuals in Power BI - Build Whatever you Want