Full-fidelity Excel & pinning to Power BI
One of the first Excel-Power BI features I worked on was an experience dubbed 'Full-fidelity Excel'. It is a version of Excel Online hosted within the Power BI interface. This came out of a user-request to be able to see their Excel workbooks in Power BI.
The problem
Initially, the way that Power BI dealt with Excel data was to shred it into fields making it ready as a building block of a Power BI report. However, there are a couple limitations with this. The data needs to be formatted in Excel correctly (which wasn't always apparent to users) and also once it was in Power BI, there was no way for the user to see it in its Excel spreadsheet/workbook format. The introduction an Excel Online interface within Power BI, helped solve these pain points for users.
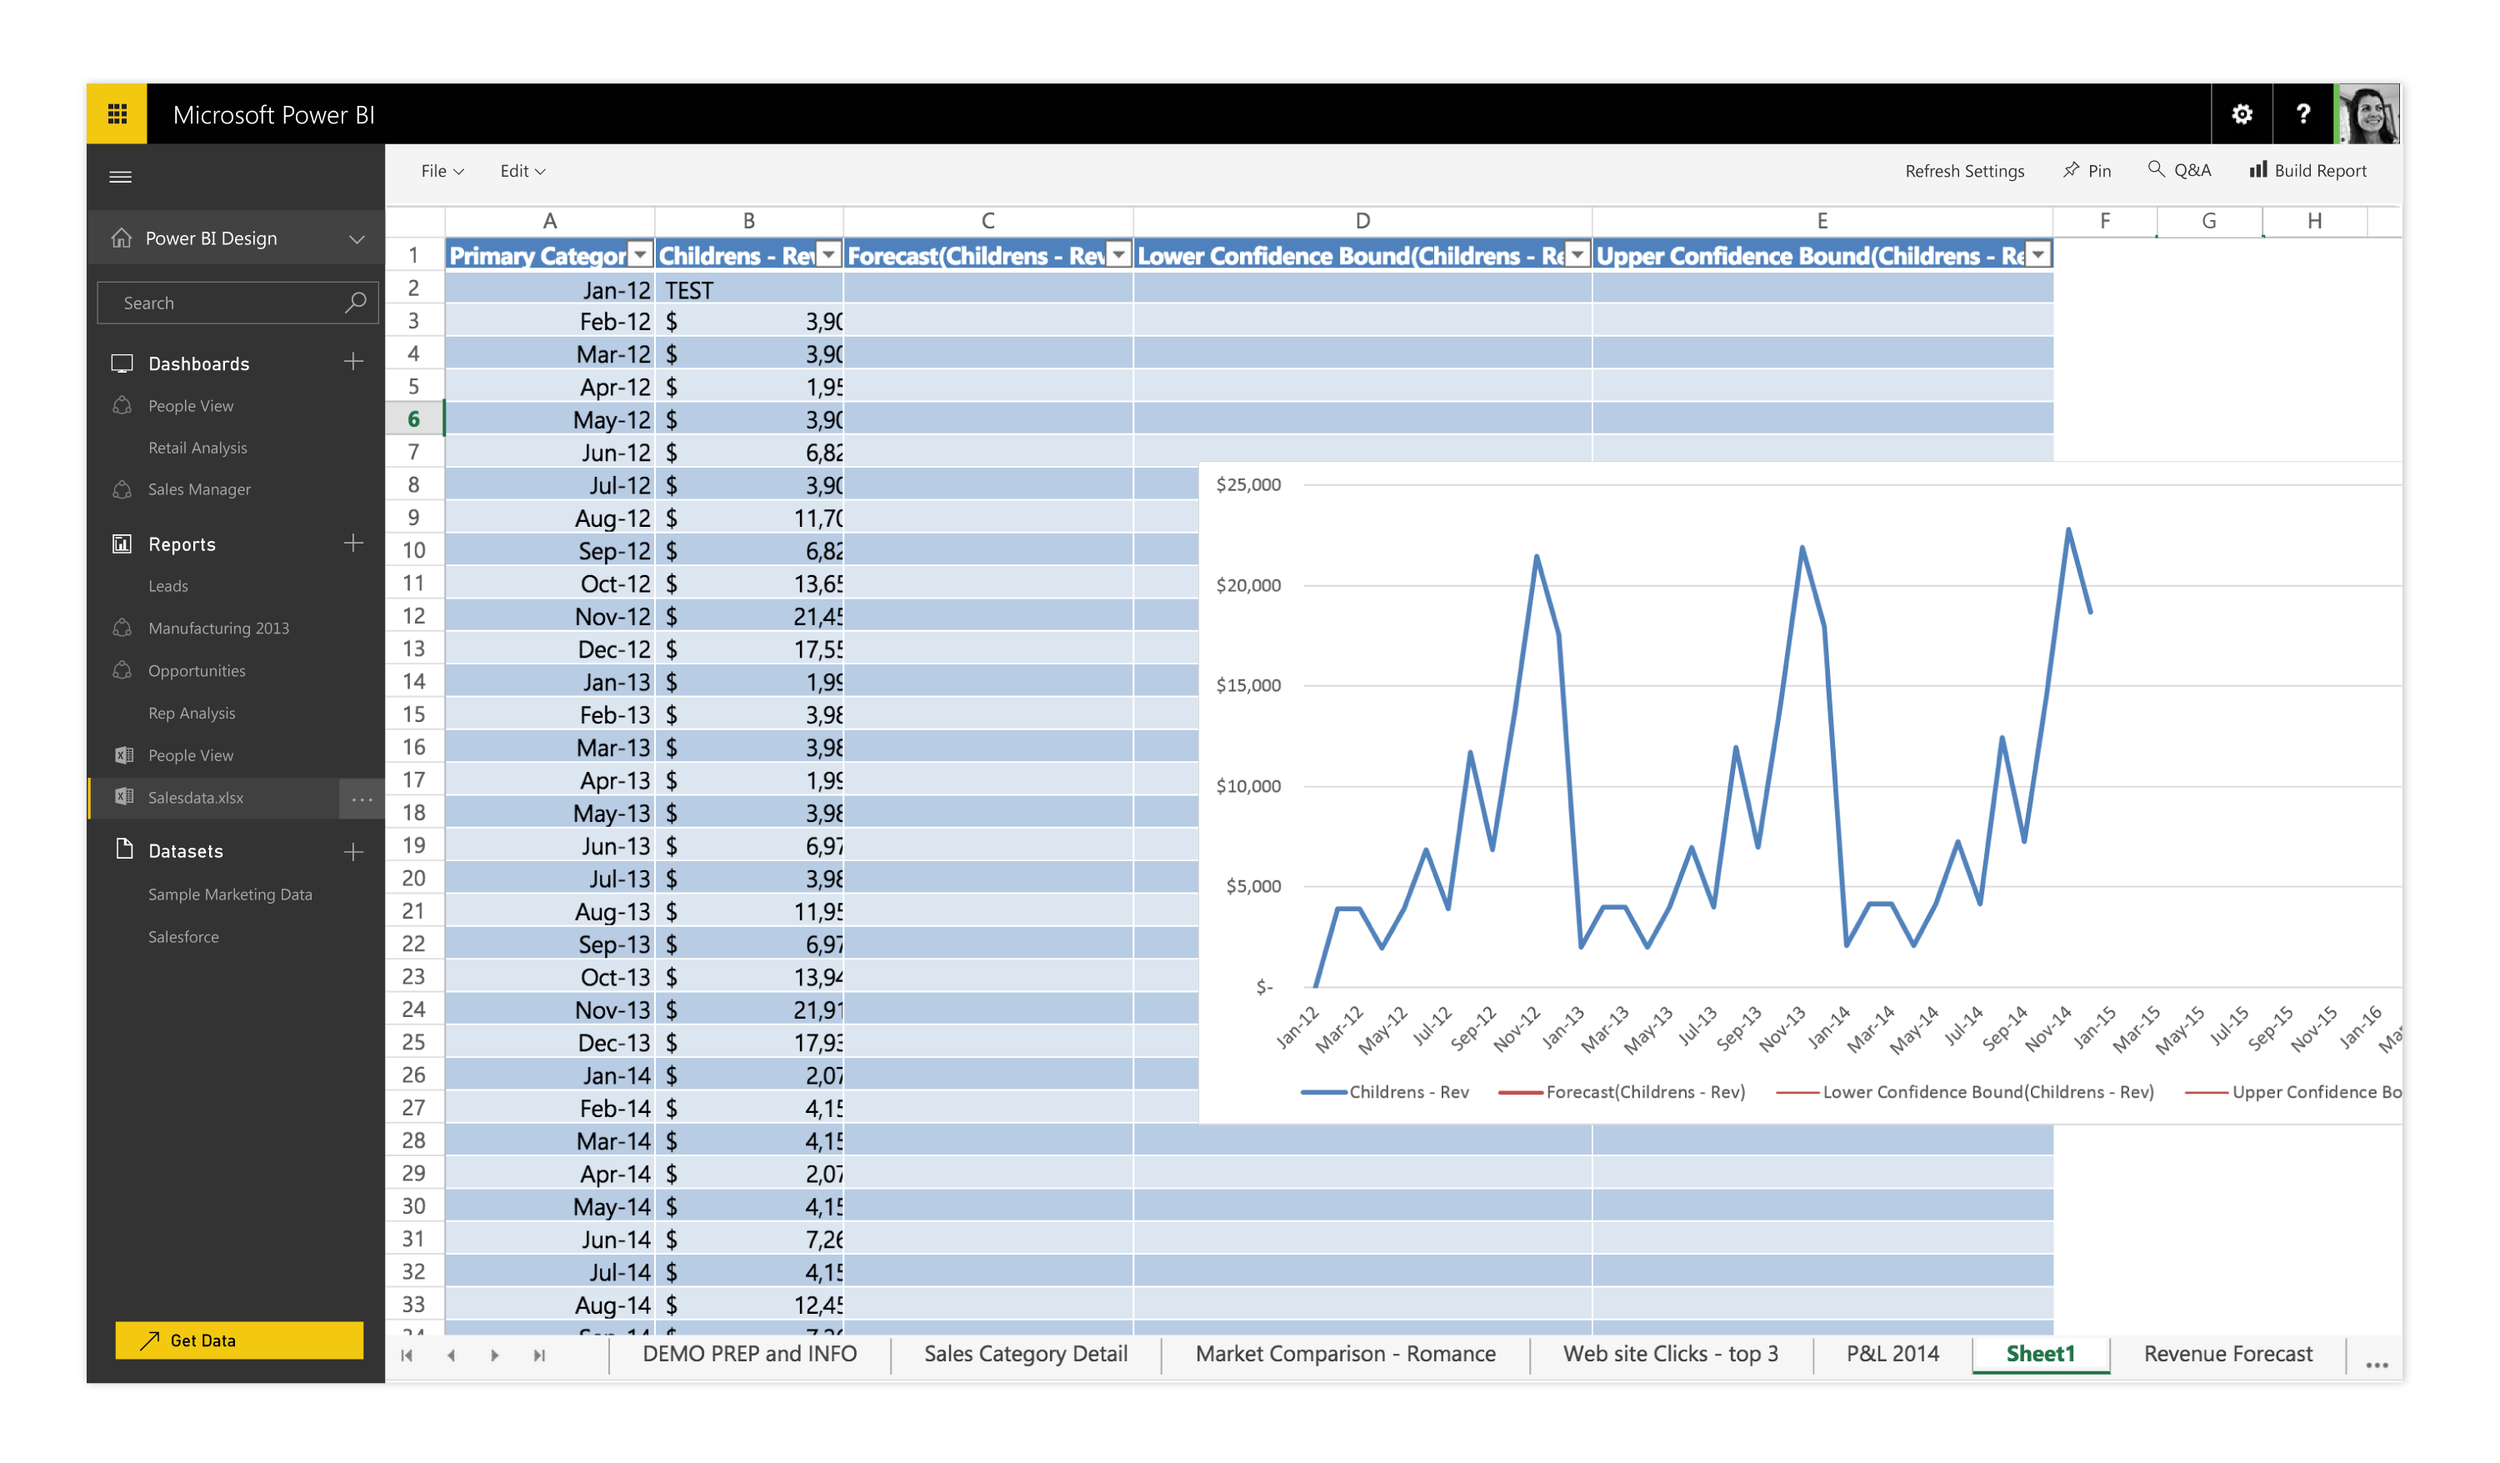
Once the initial Excel online interface was in place, we introduced a feature called Pinning, which allowed users to pin ranges or charts from their workbooks to Power BI dashboards. Below are some early iterations for pinning - including explorations of the full-fidelity Excel navigation. As this was earlier in the product's lifecycle, the navigation and shell look pretty different than they do today.
Pinning interface
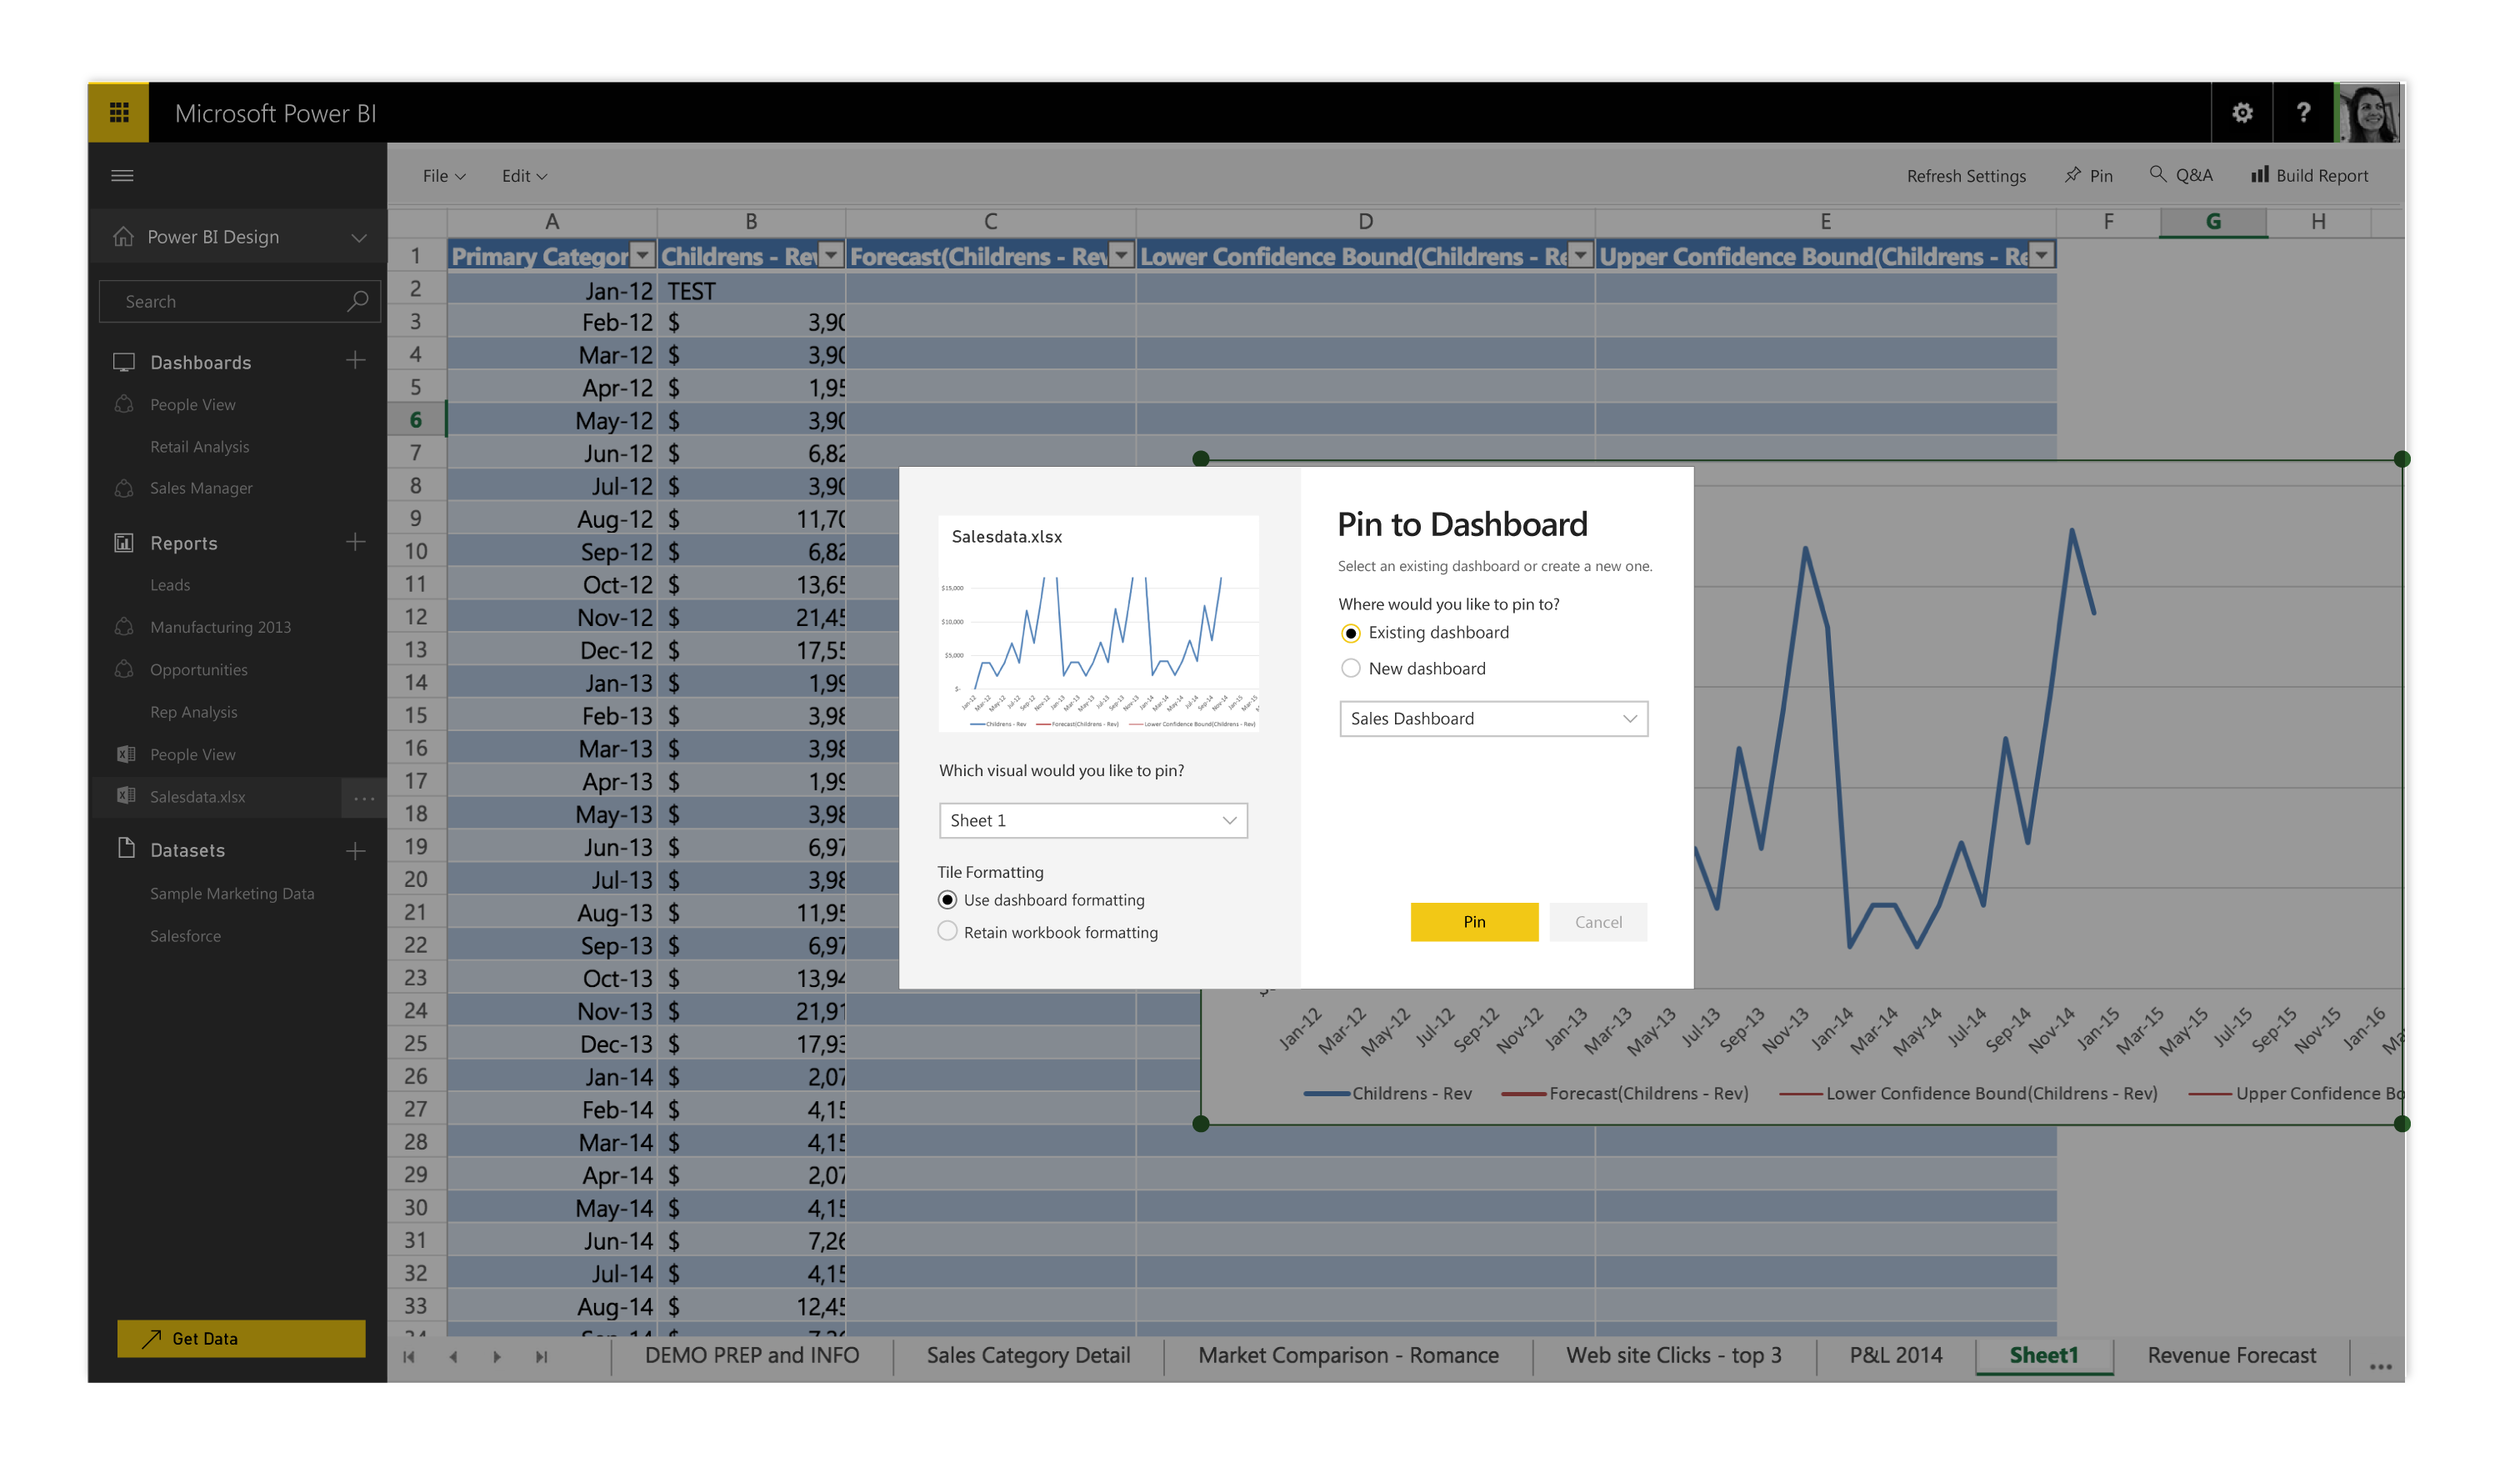
This image shows the dialog for pinning visuals from Excel reports to Power BI dashboards. On the left is a preview of the visual, some formatting options and on the right is an interface to select where in Power BI to pin it.
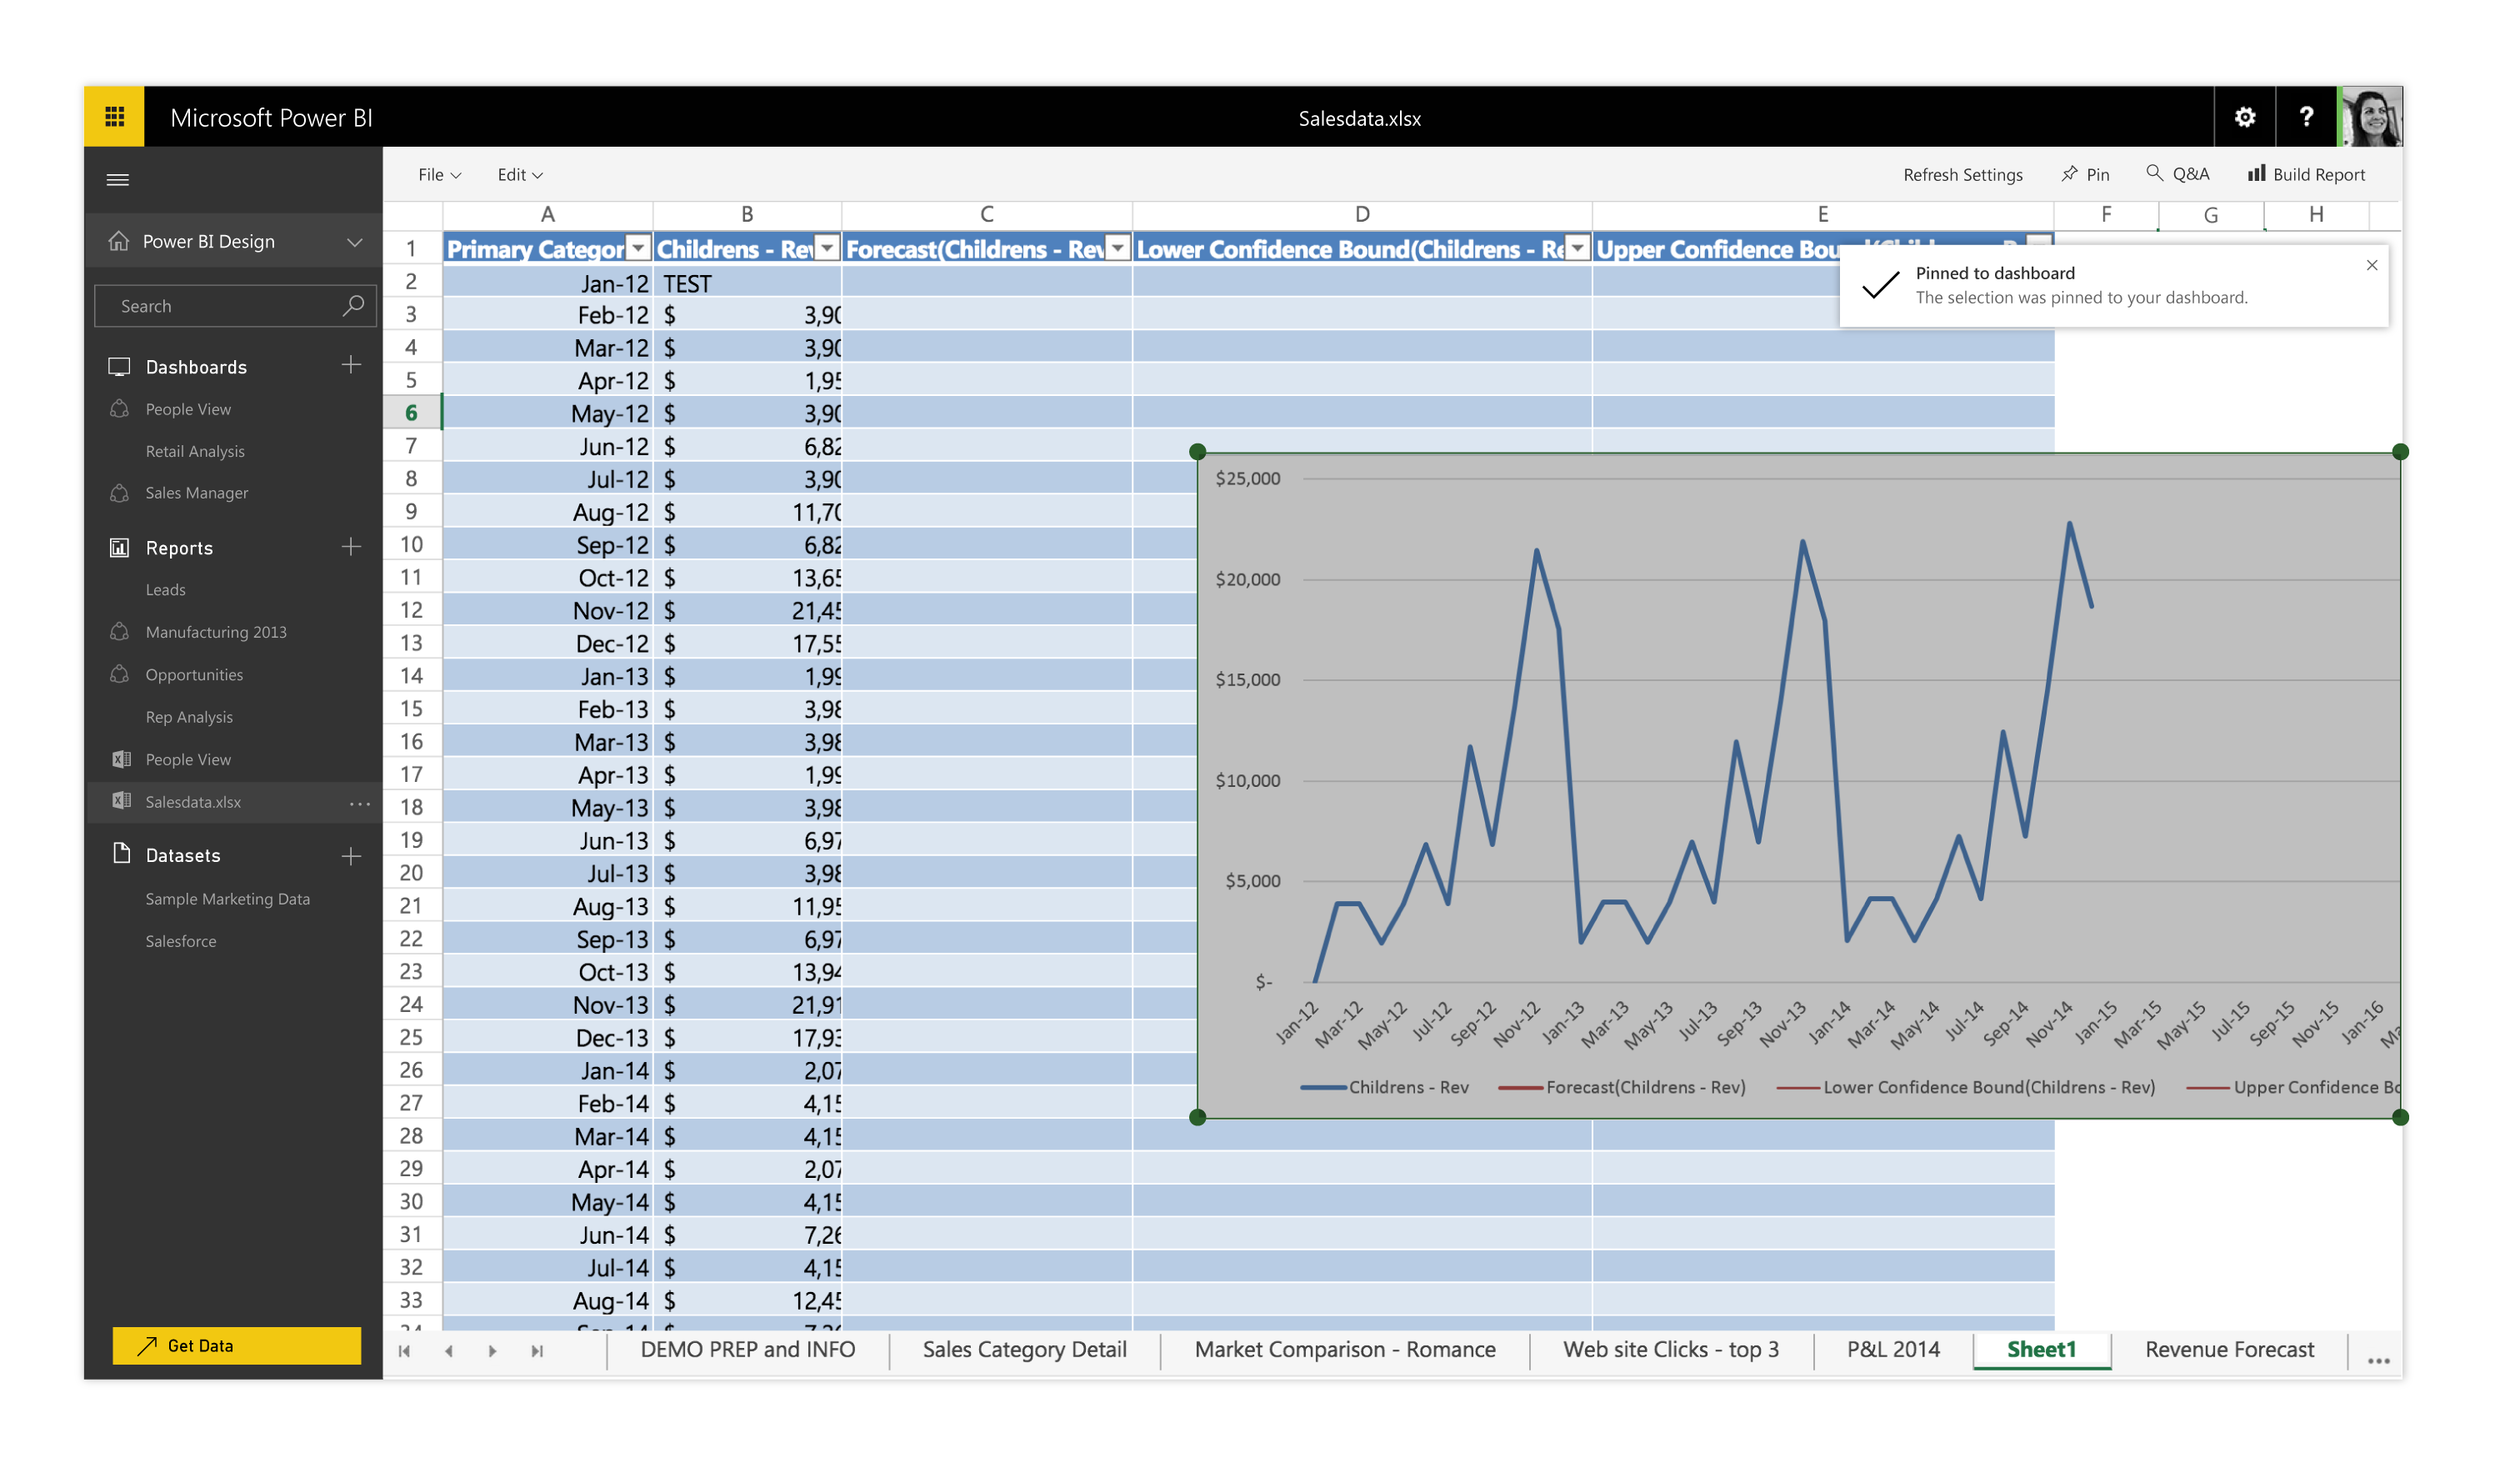
This visual shows a success message for when a user has pinned an Excel visual to a Power BI dashboard. In our usability testing, we found that these confirmations helped build confidence for users.
Design process
I worked on these Excel integration features with an engineering and PM team based in Haifa, Israel, who didn't have local design support. These features were interesting to work on because, as with other PBI-Excel features, I needed to have buy-in from and reviews with the Excel team as well as our Power BI team (in both Redmond and Haifa).
Since this experience was based on the existing Excel Online, I also needed to engage marketing for the correct display of Excel branding within the product. After getting the pinning functionality baked in to full-fidelity, I started to refine the navigation and branding with sketches, early iterations, user-testing, and finally higher fidelity designs. Below are some of the mockups and concepts as well as more fully flushed out versions of the experience.
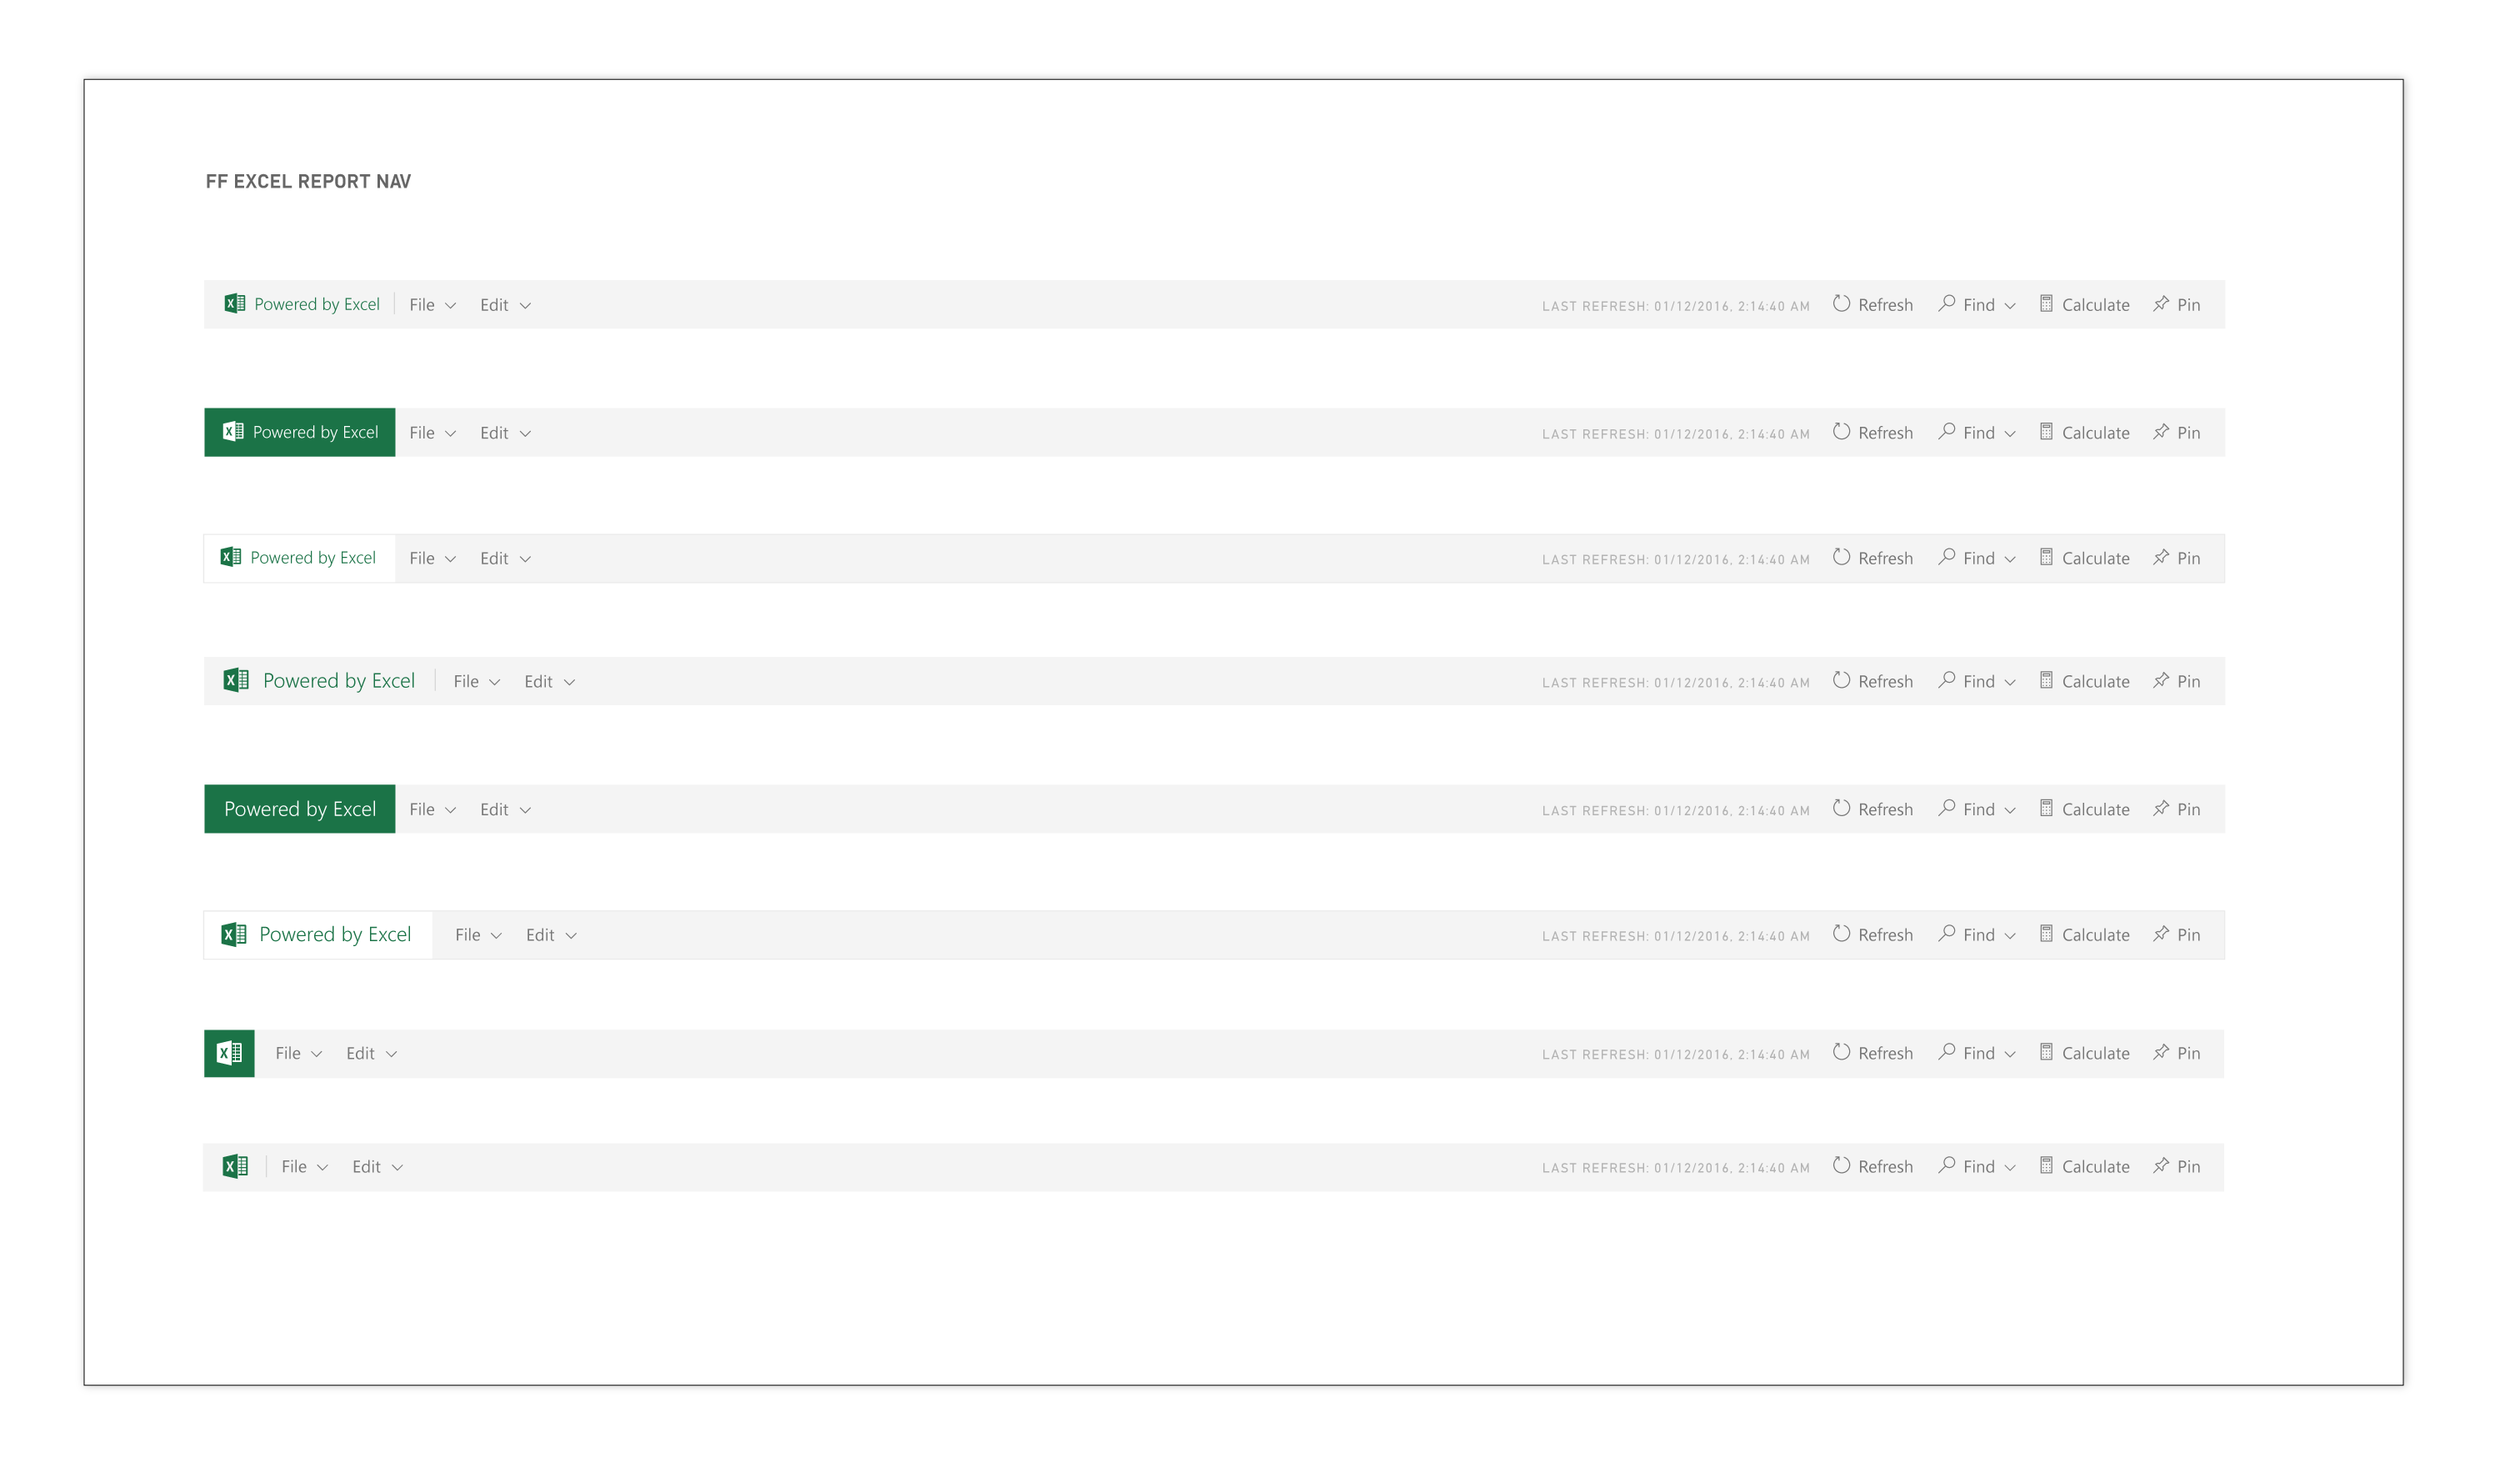
Early concepts
A variety of early concepts showing different ways of representing the embedded Excel Online experience within the Power BI report canvas.
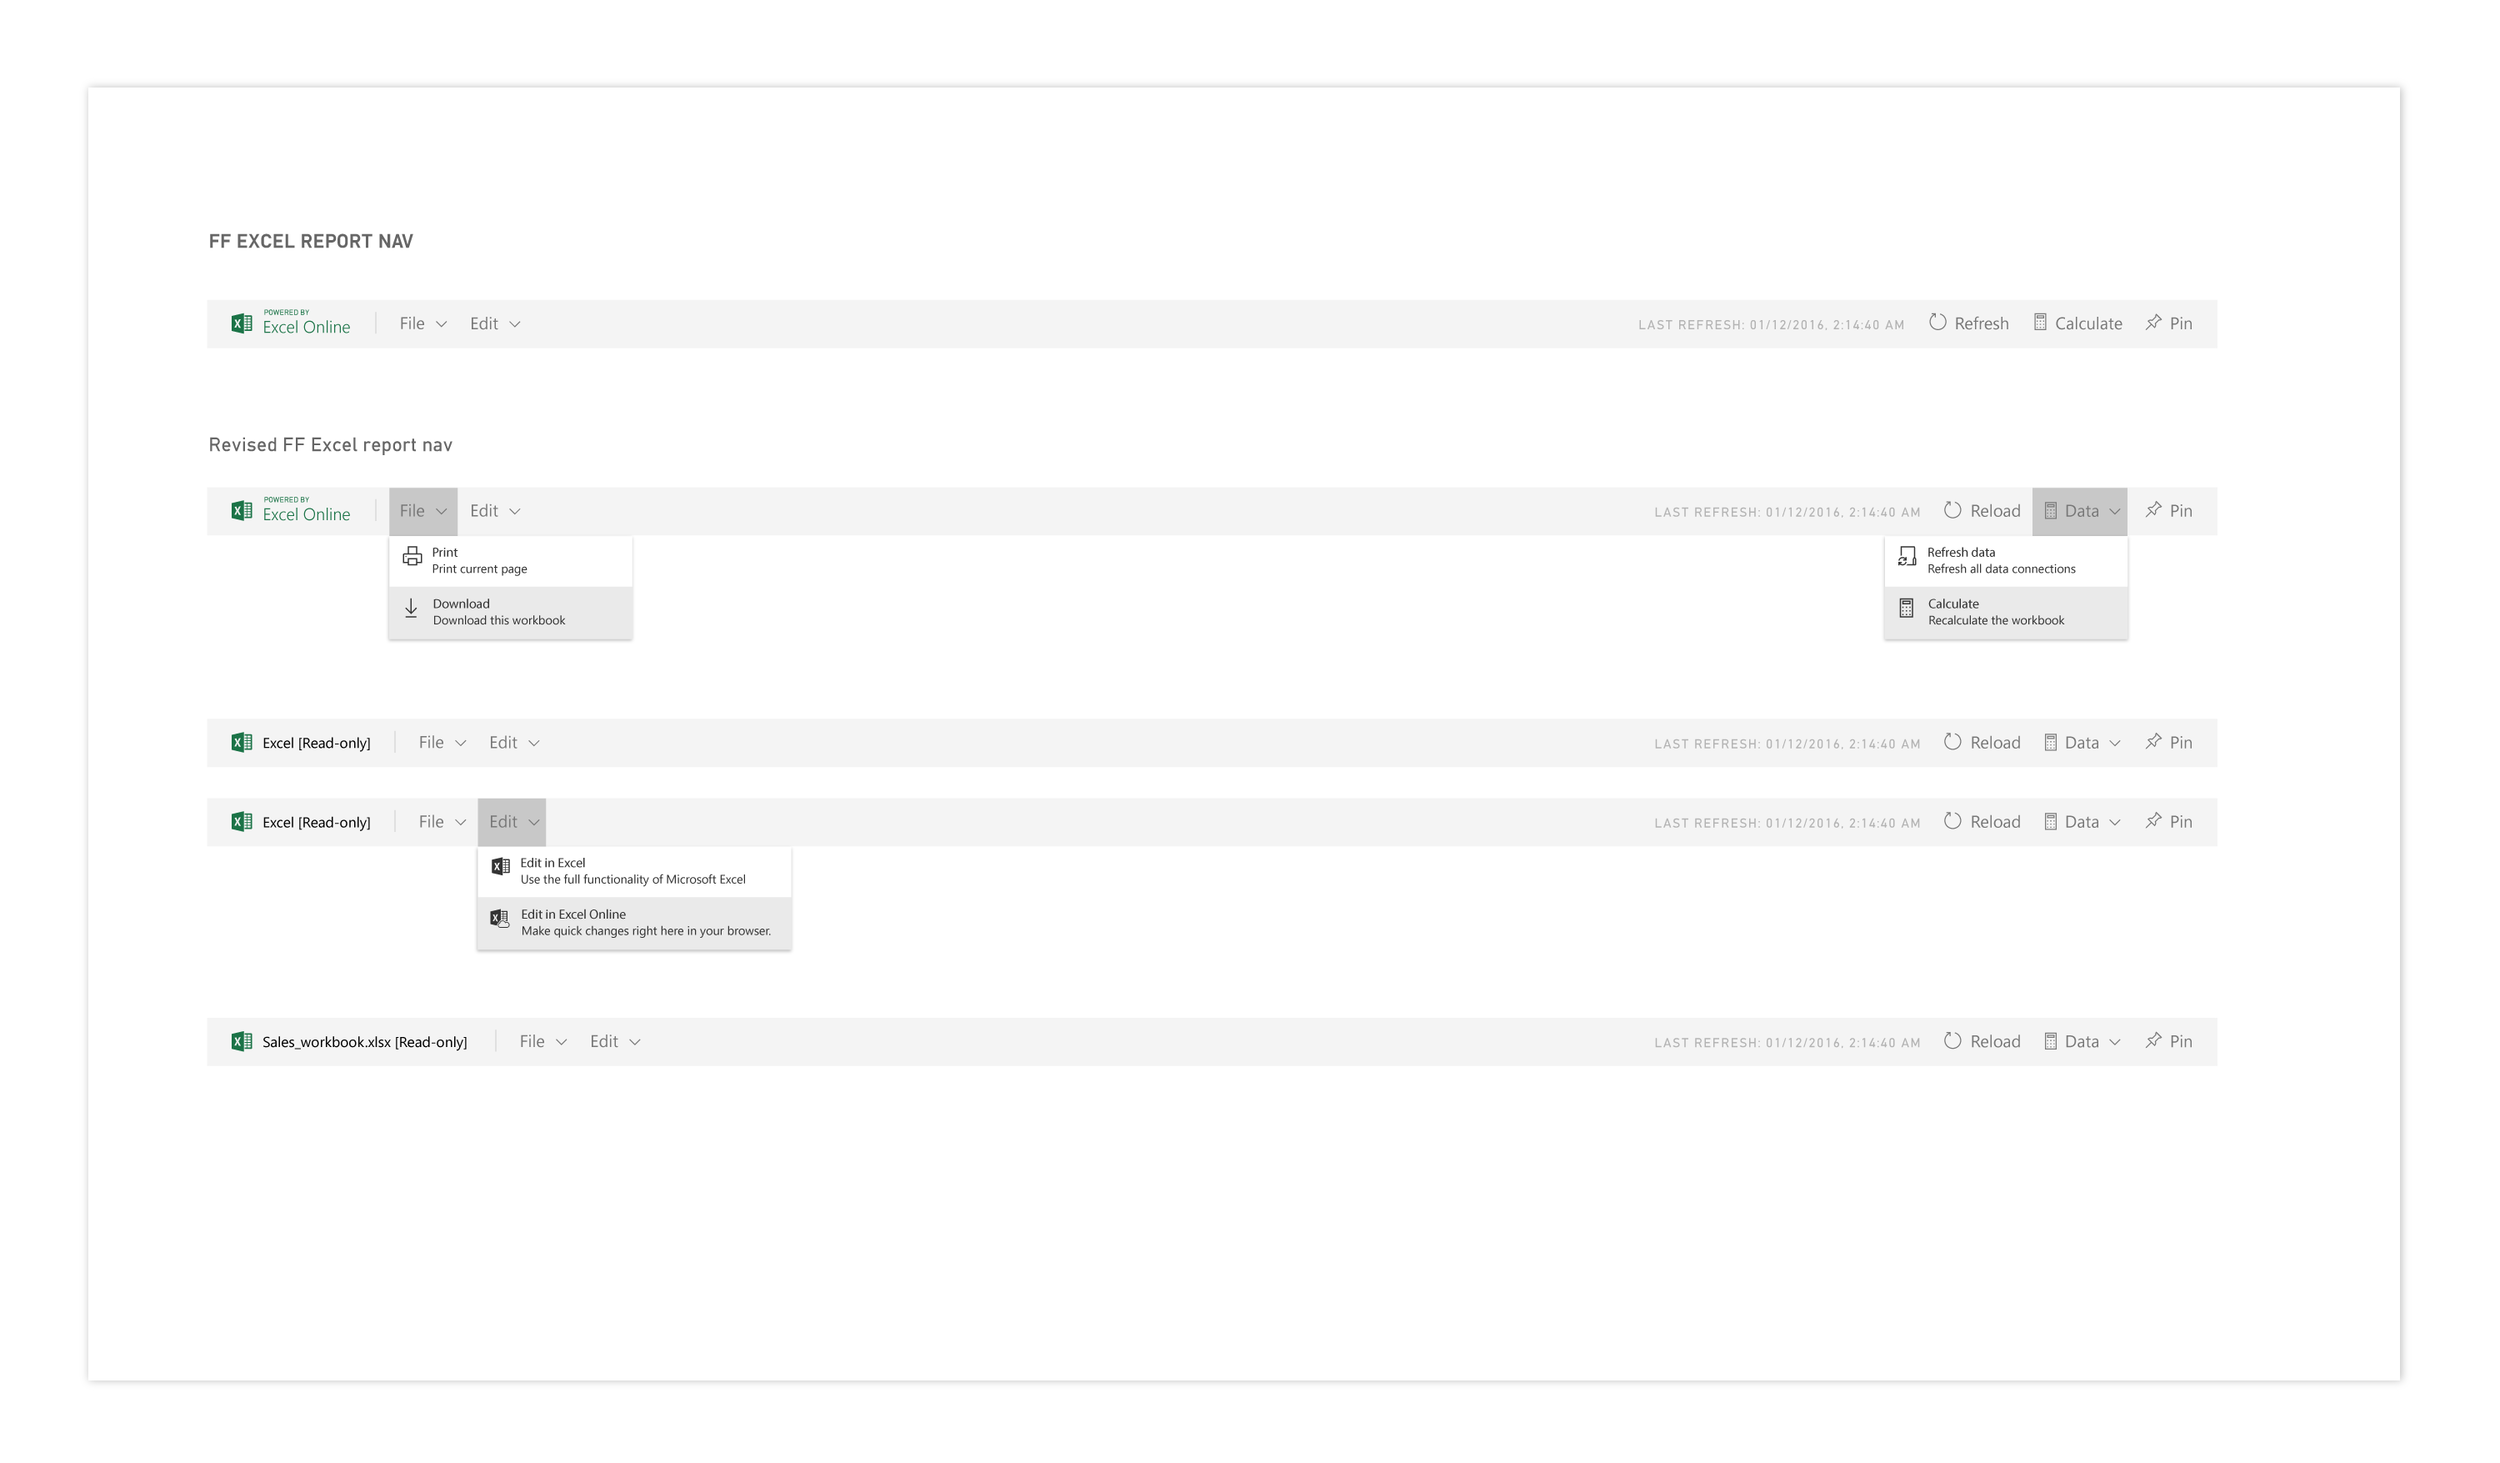
Content design also played a large role in determining the best way of representing Excel inside Power BI. We worked closely together to iterate and test different concepts.
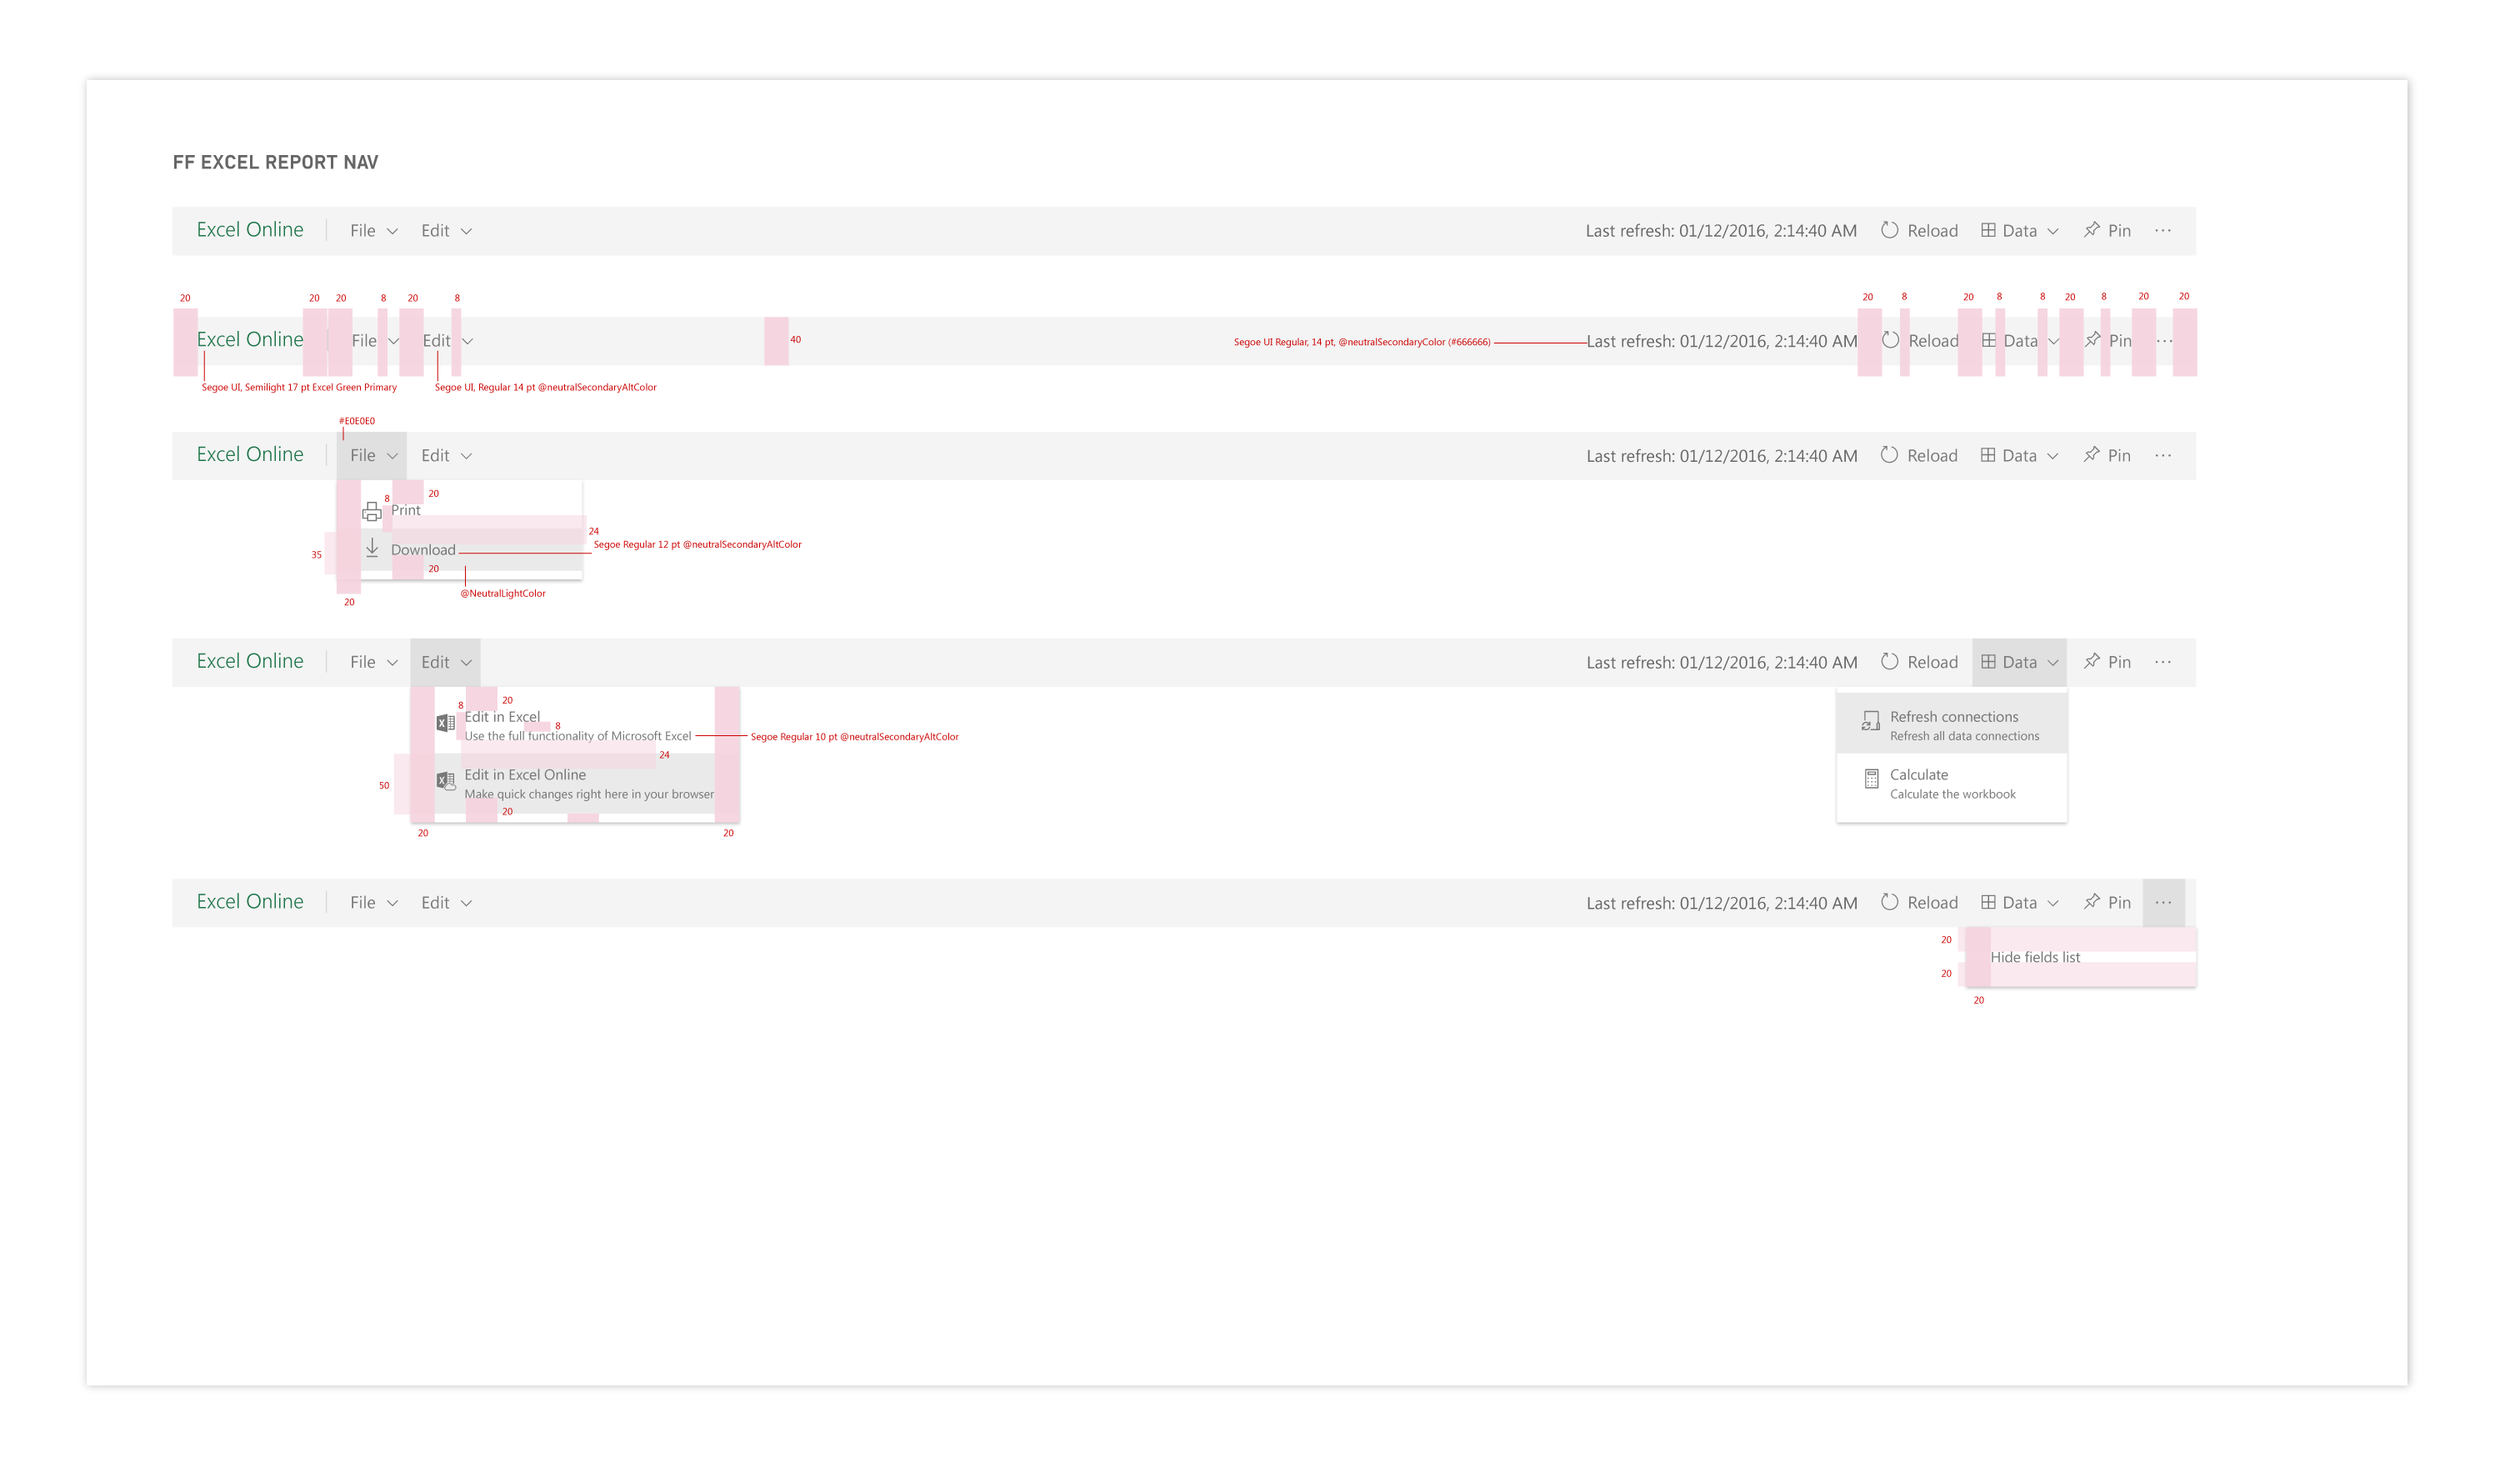
Final report nav
Finalized spec for report nav, with approved Excel online branding and updated pinning and data functionality baked in.
Design challenge #2: Power BI Publisher for Excel
I also worked with the team in Haifa and led design on the Power BI add-in for Excel called "Power BI Publisher for Excel". The purpose of this add-in is to allow users to pin ranges and charts directly from their Excel workbooks to their dashboards in the Power BI web service. Over time, we added in functionality like the ability to connect to data stored in Power BI, directly from Excel, and work with it in Excel. One of the interesting challenges with this project was considering how to fuse the stylistic elements and guidelines in Power BI with those of Excel.
Design process
I focused on the analyst persona in Power BI, who also crosses over with an Excel persona to help guide my design decision making - ie prioritizing information density over simpler and more spacious UI geared towards business end-users and consumers. We started out with a basic set of controls for the add-in, optimizing for the pinning scenario.
I worked with the Excel team to determine a design direction, and we user tested the add-in in our feedback sessions. I also had the opportunity to work with our prototyping team as we developed some of these scenarios over time. The images show a trajectory of early sketches, followed by initial versions of the add-in, to some of the later, more robust explorations that included settings and more.

Early sketches
Sketching concepts for how to integrating pinning functionality to Power BI from the Excel add-in.

Iterating on the ribbon
Some iterations on the dedicated portion of the ribbon that the Excel add-in would have. We needed to include the central experience of pinning but also a way for users to manage their existing pins and view in Power BI.
Next steps
After sketching out several concepts for pinning and managing pins, I started making digital mockups. Below is a collection of different ideas and concepts for pinning and managing UI. The interface needed to feel familiar to Power BI users, but also native to Excel, which was one of the unique challenges of this project. I addressed it by using Excel styles and controls, but similar interactions and layouts for tasks like pinning that were also mirrored in Power BI.
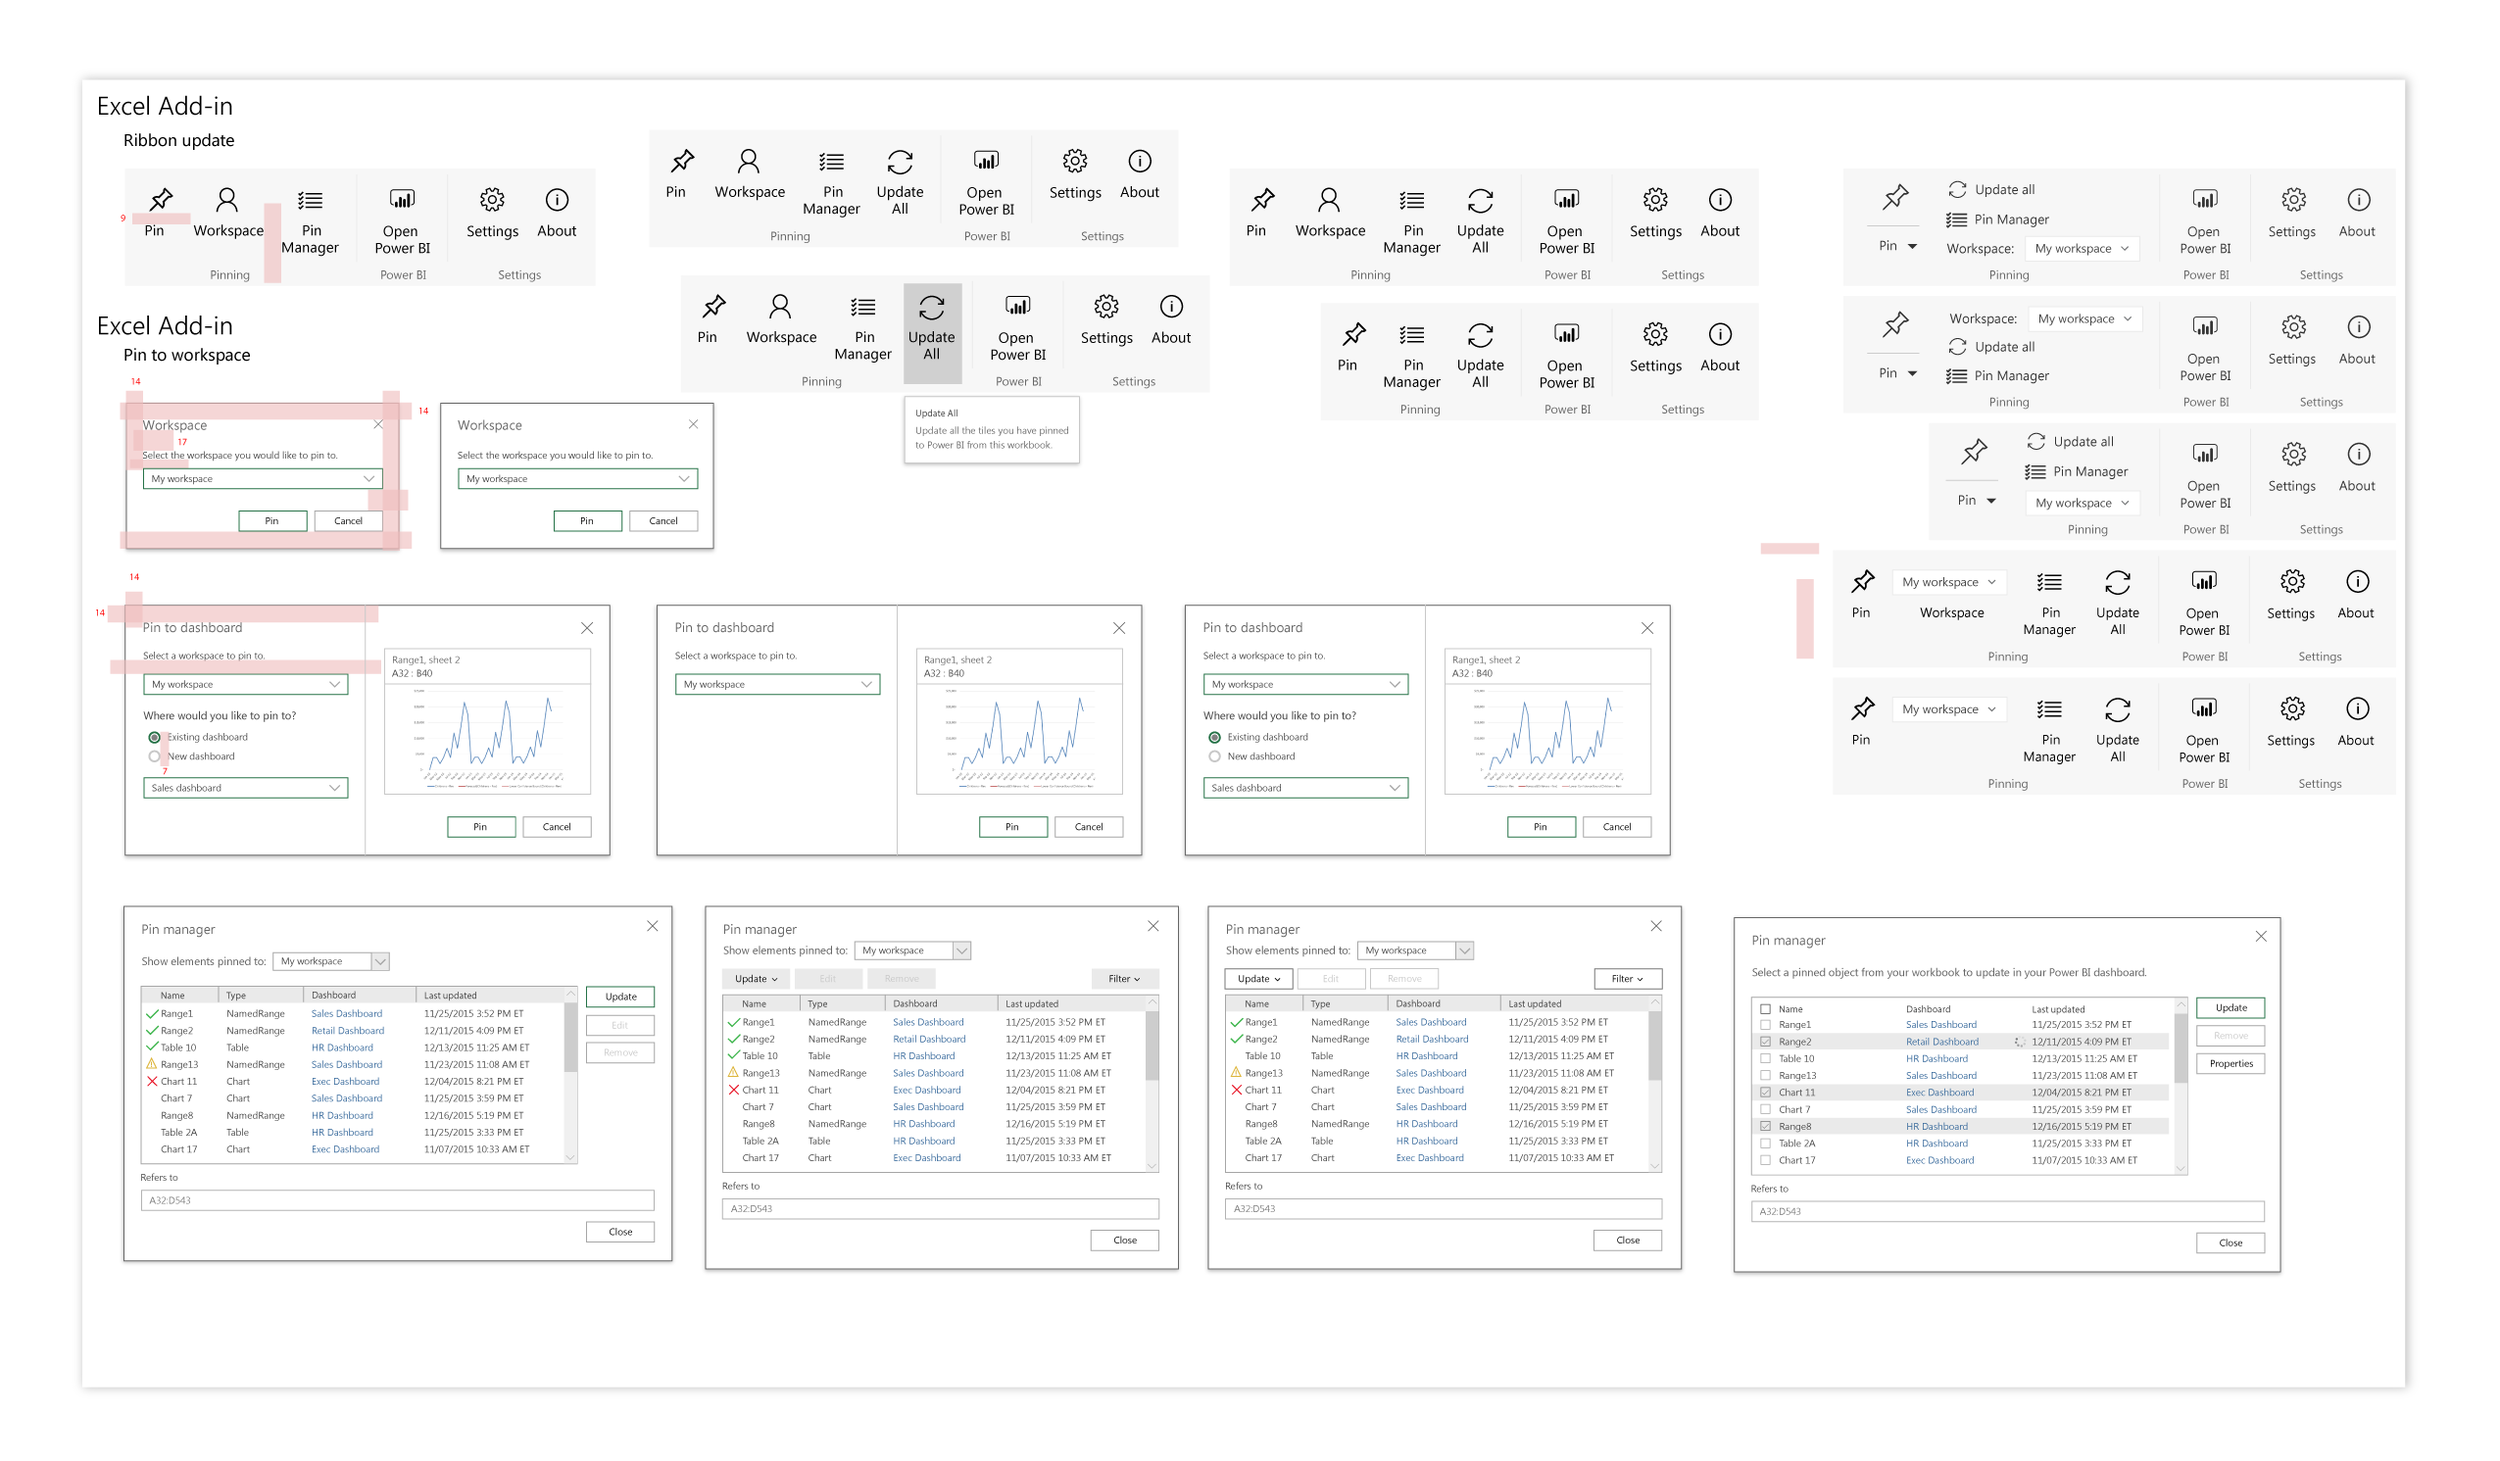
Digital explorations of ribbon, pinning interface, pin manager and profile for the add-in.
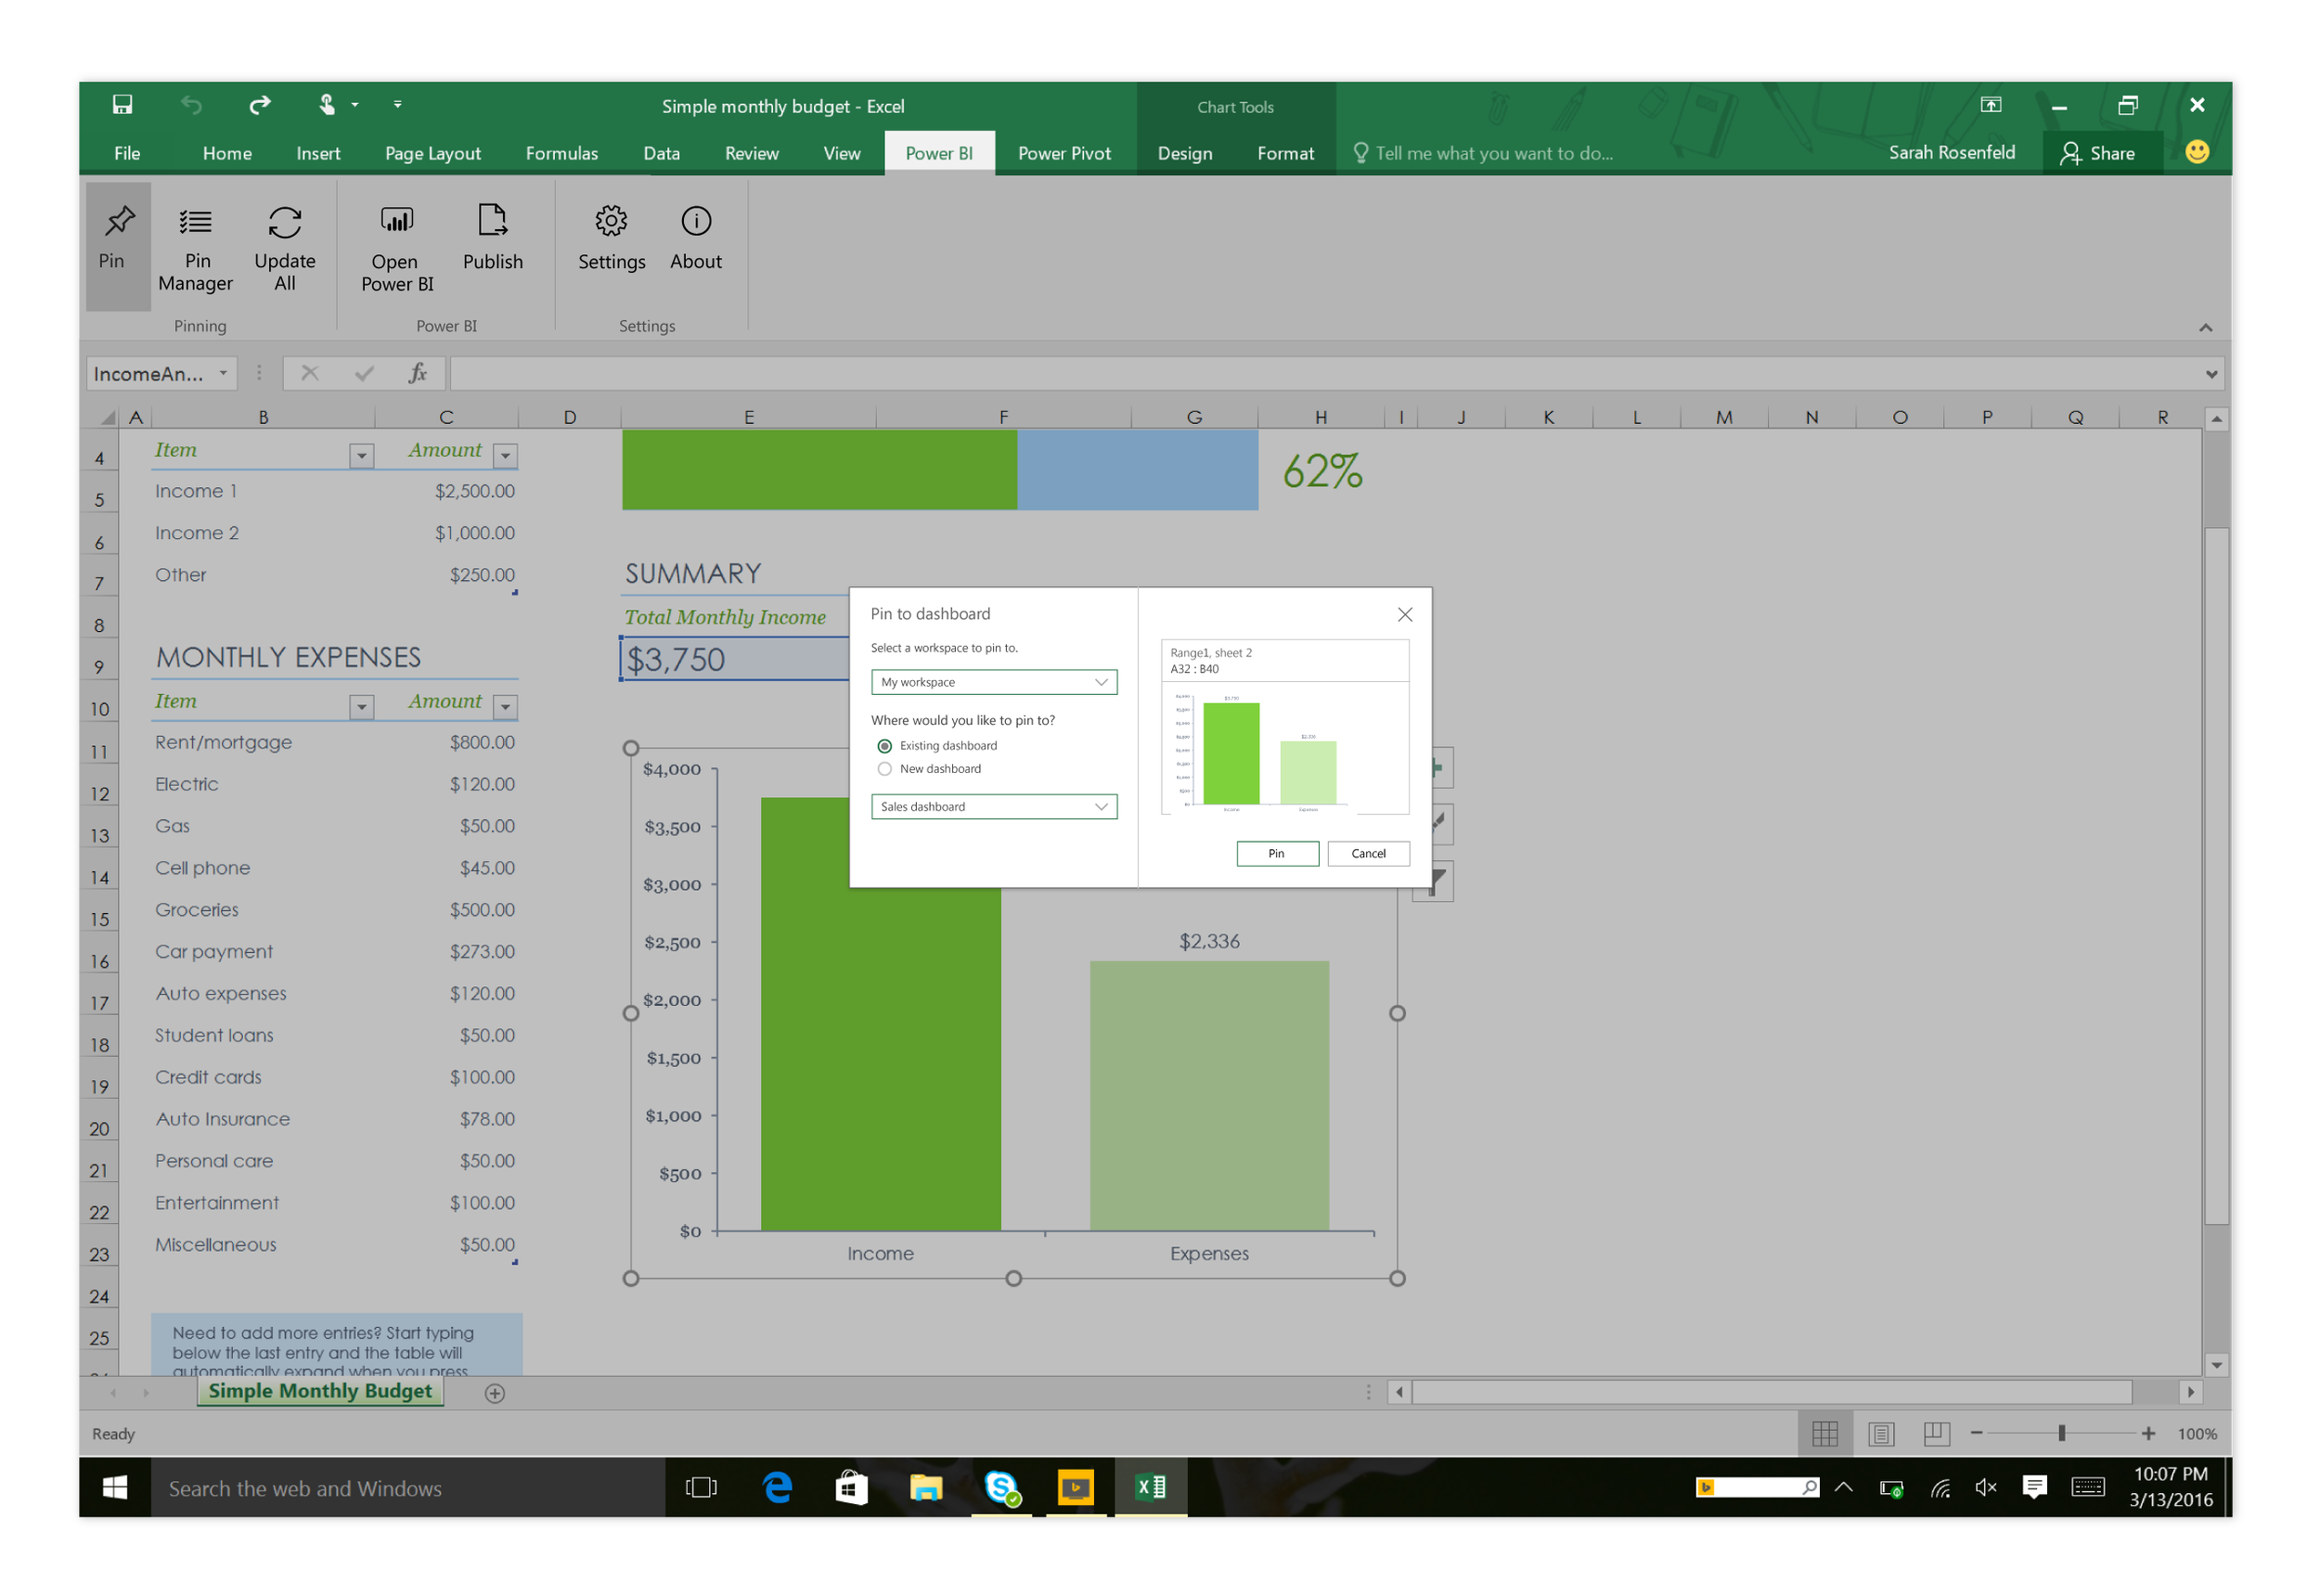
High fidelity mock-ups
After exploring several options and user testing, I landed on the following designs for pinning Excel visuals to Power bI dashboards from the Excel add-in.
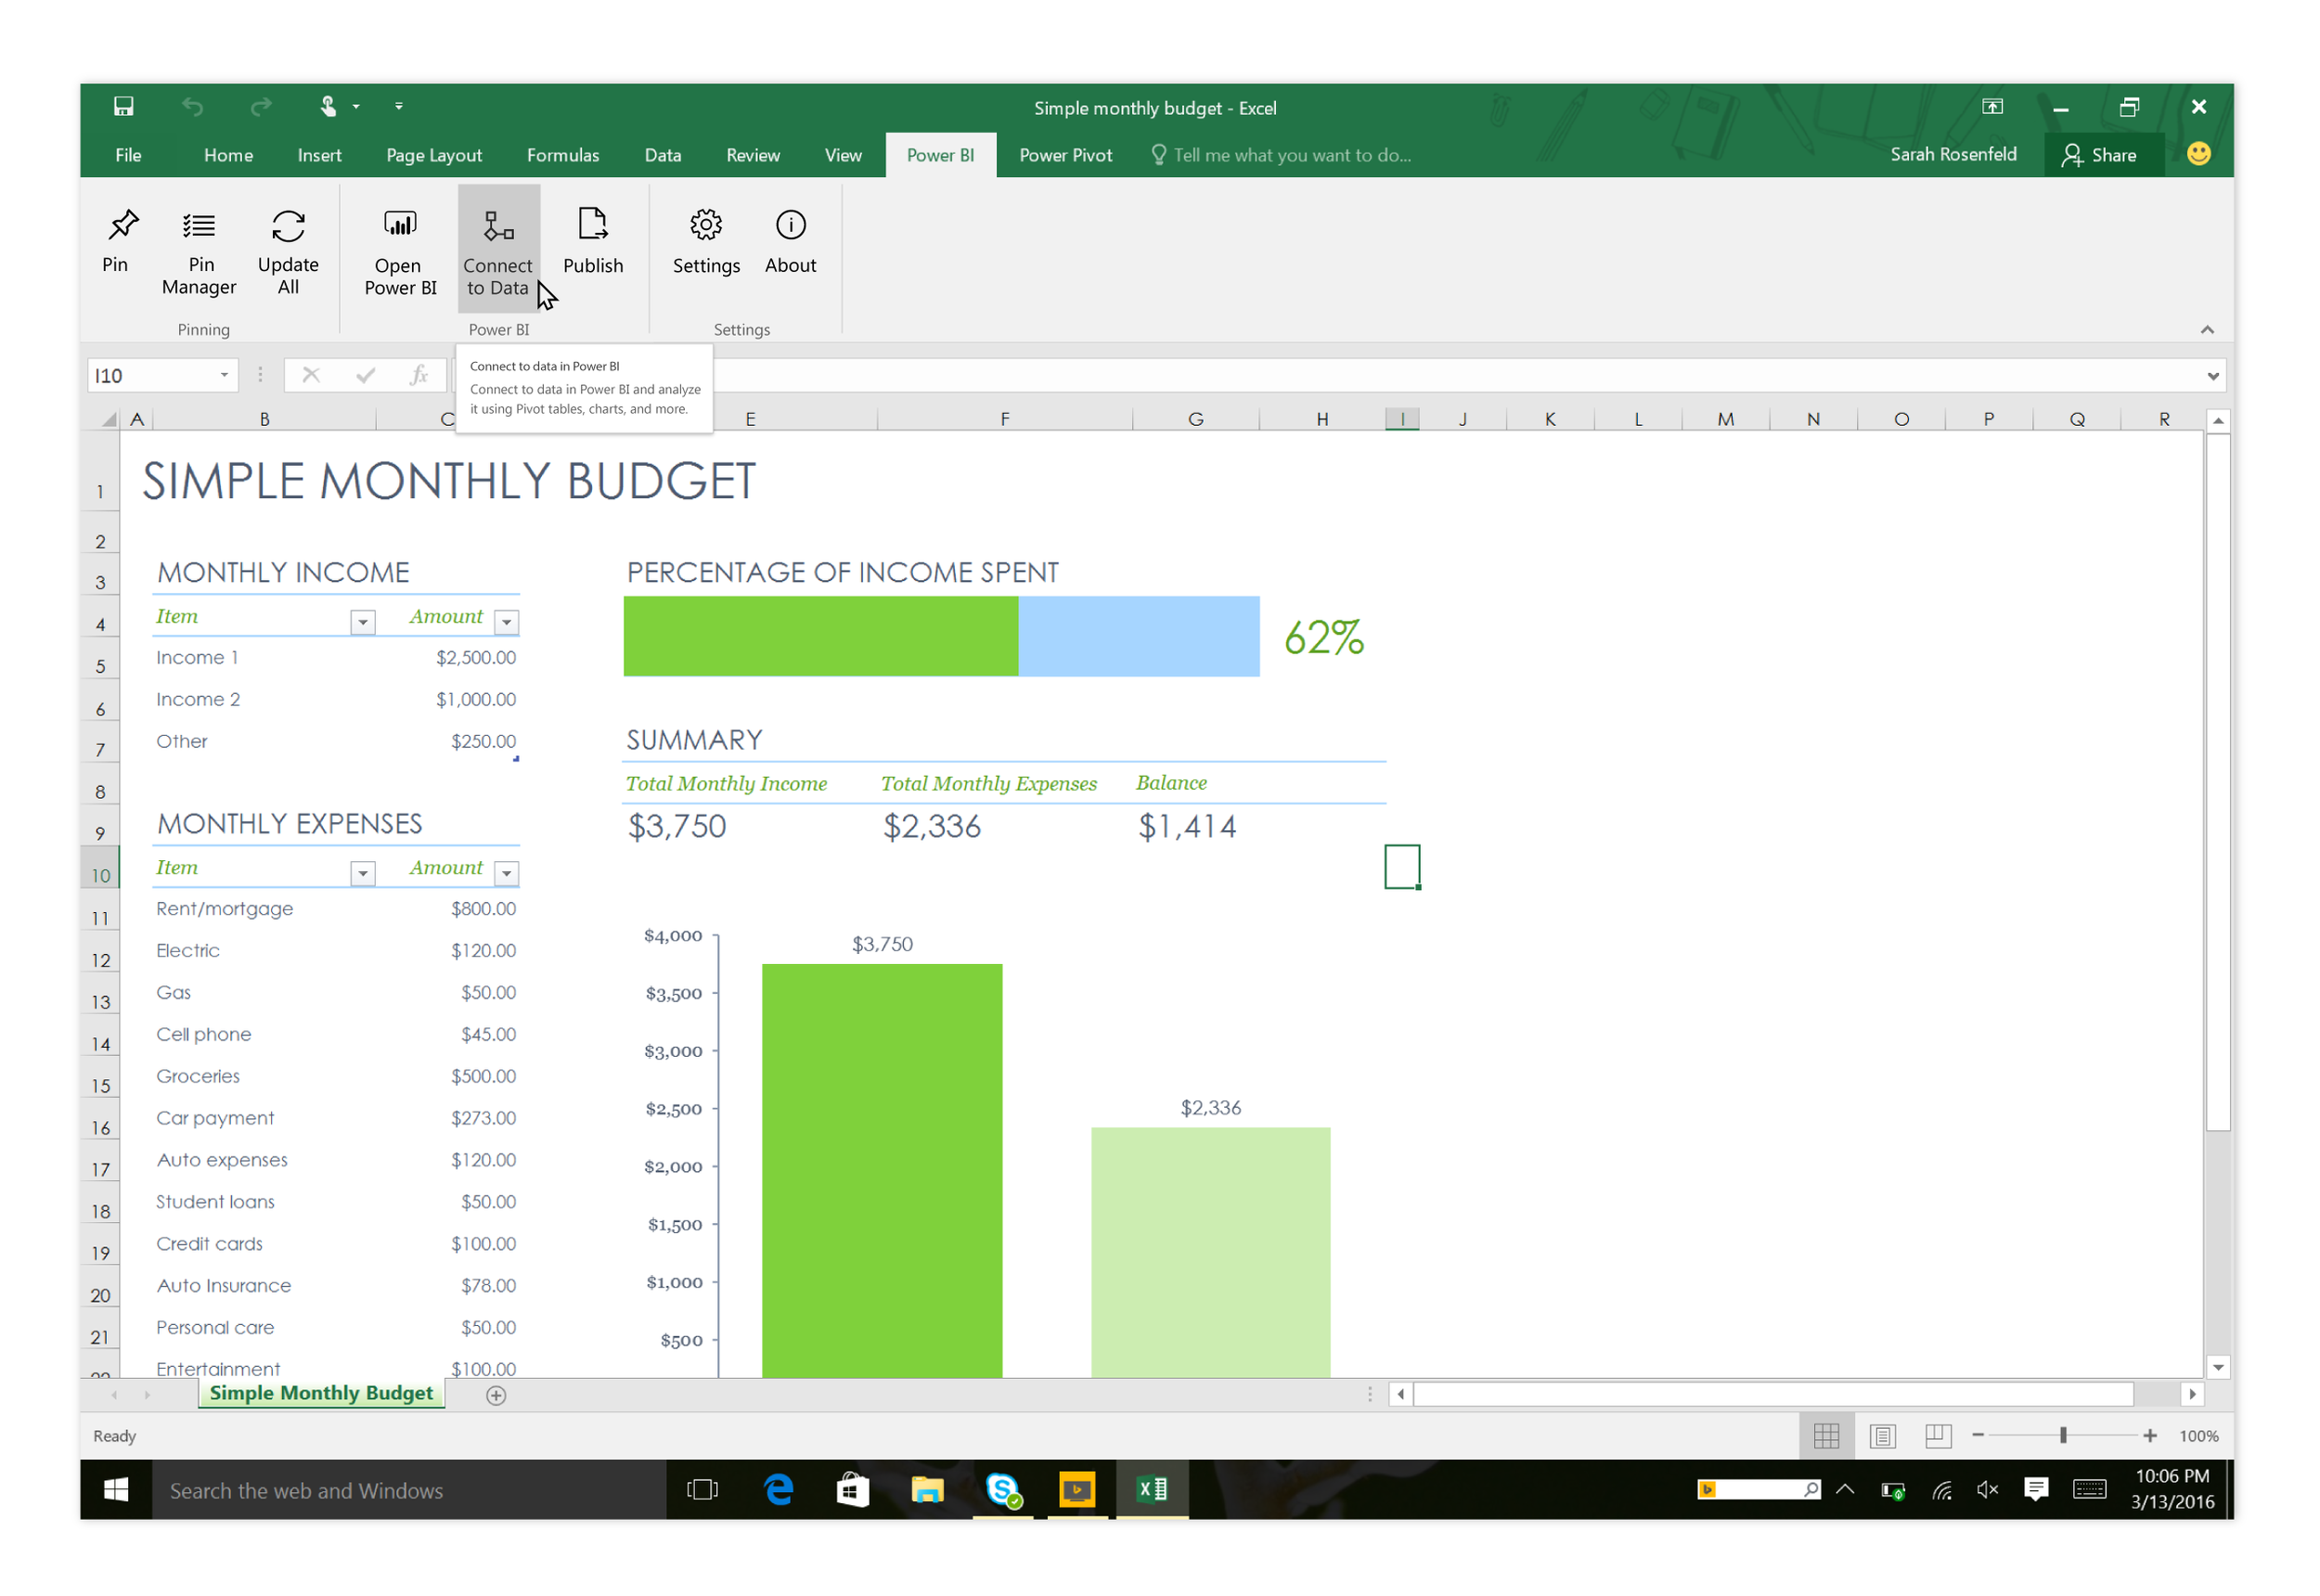
Design challenge #3: Connect to Data
Another new feature in this suite of integrations was the ability for users to connect to data stored in Power BI, while in Excel and use the full spectrum of Excel tools to analyze it. This was a big customer ask as many of our large tenants use Power BI’s cloud storage space to keep live and streaming data, but it doesn’t have the same set of analytics tools as Excel.
Process & solution
After talking with customers, the product team and I came up with the idea to include this feature in our newly released Power BI add-in for Excel. (Now called Power BI Publisher for Excel). I created a new entry point in the ribbon for users to connect to their Excel data and a fairly simply dialog to manage the process.
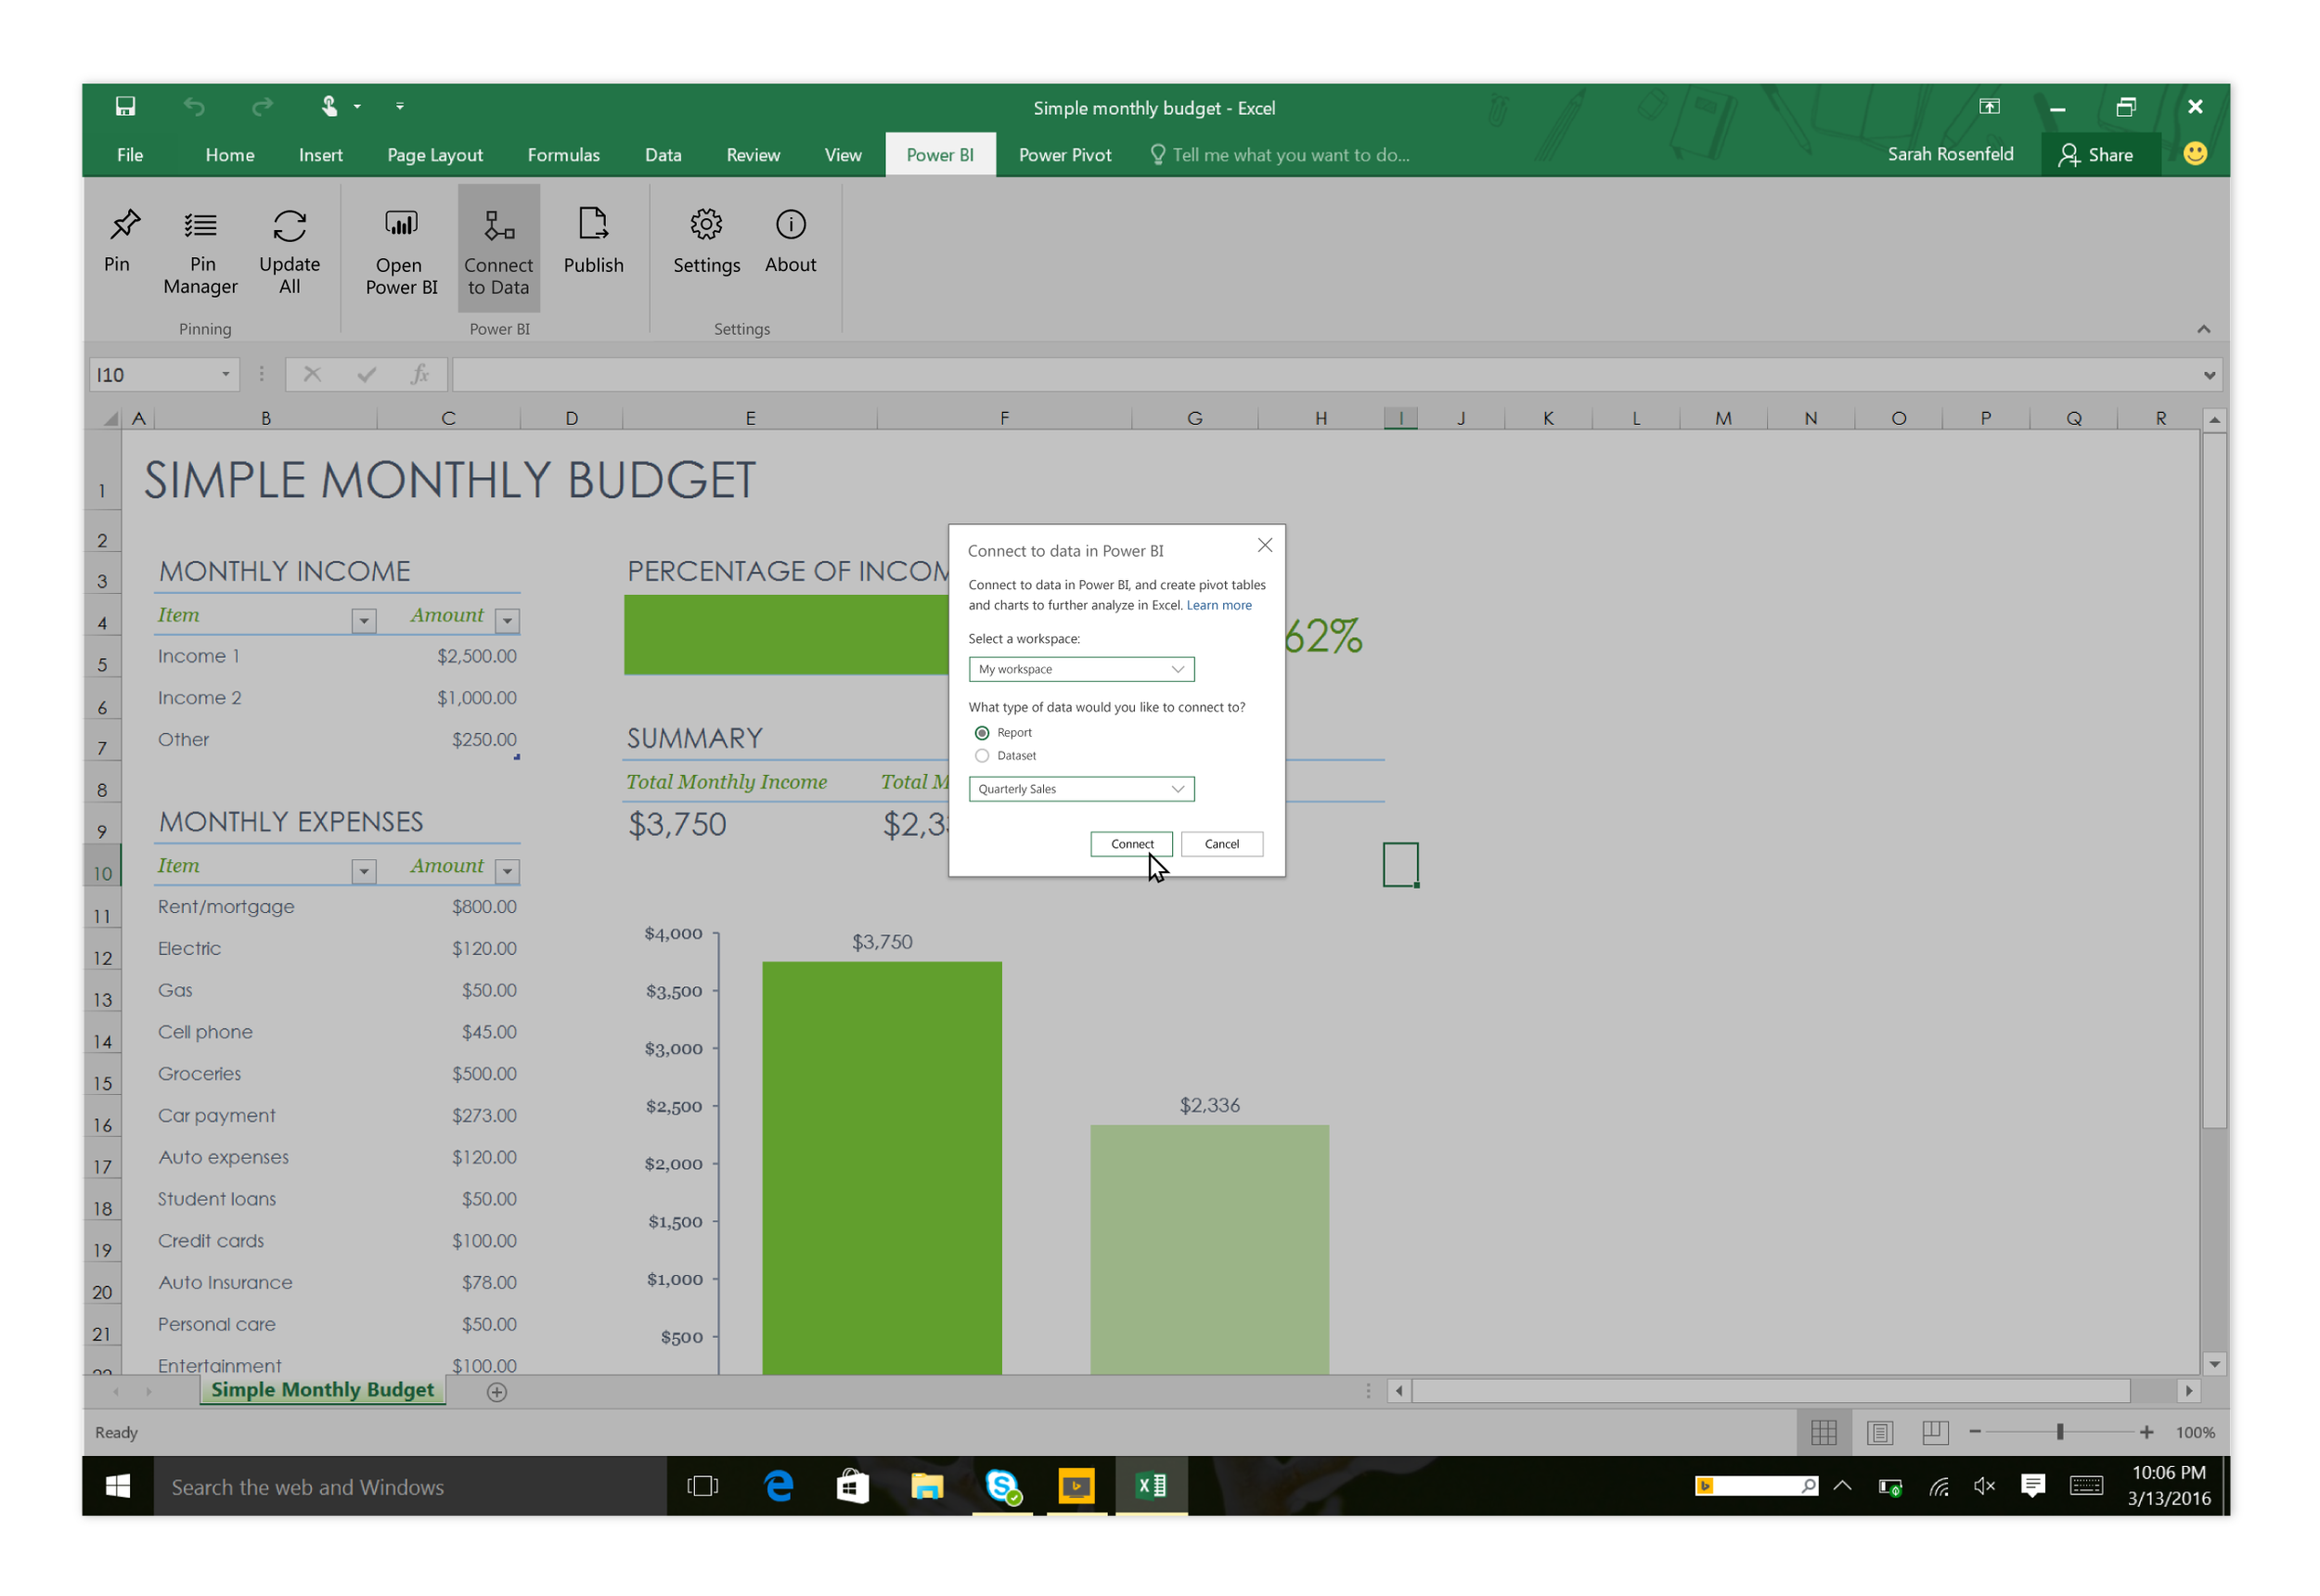
Connect to data dialog
This dialog helps users connect to their Power BI data while in Excel so they can perform analytic operations on it. The interface is fairly simple and gets the job done.
Feedback
Users loved this feature! We had great feedback almost immediately after release as it provided a solution to an existing customer pain point.